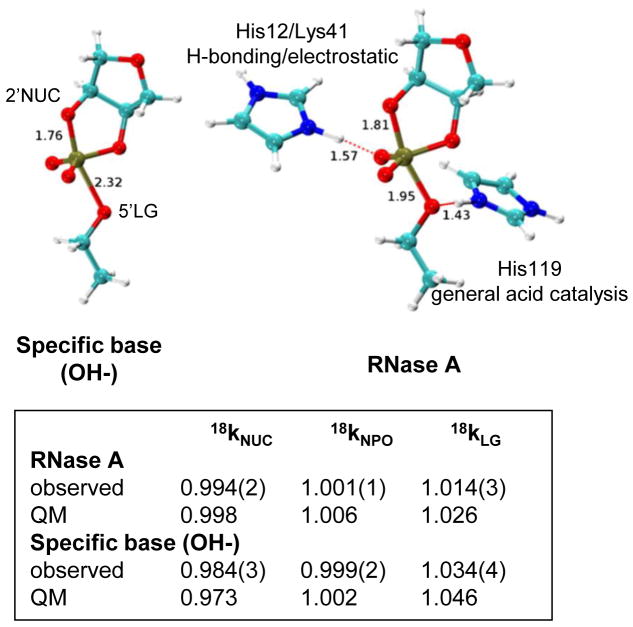
Figure 4.
Transition state models for specific base catalysis (left) and ribonuclease A (right). The TS models used for the calculated KIE values are depicted with the 2′O-P and 5′O-P bond lengths indicated. For the RNase A model the distances between the His12 and His119 protons and the non-bridging oxygen or 5′O leaving group, respectively, are shown. The catalytic modes resulting in altered TS charge distribution for RNase A are indicated.

