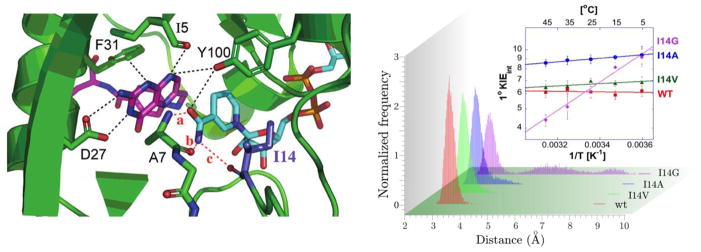
Figure 2. Role of I14 on Local Motions in DHFR.

Left Panel: Active Site of E.coli DHFR (PDB ID 1RX2) where the nicotinamide is in blue, the folate in magenta and I14 highlighted as metallic blue. Right Panel. Histogram showing the normalized frequency versus DAD for WT (red), I14V (green), I14A (blue) and I14G (purple) [7]. The inset shows Arrhenius plots for the intrinsic H/T KIEs for the WT and mutants. Reprinted with permission from the American Chemical Society.
