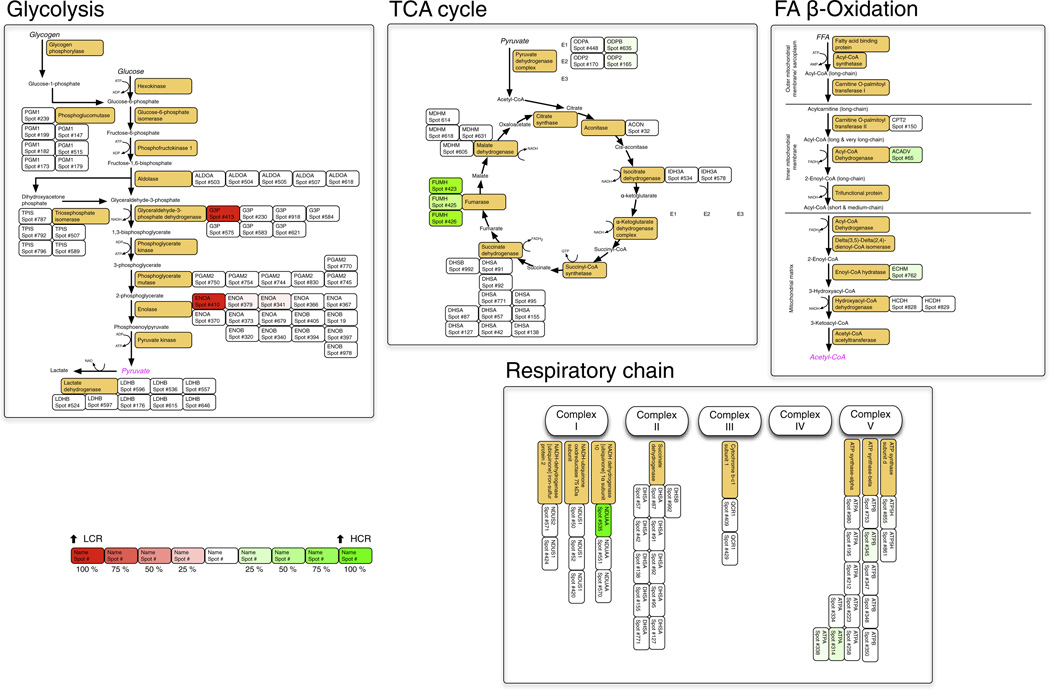
Fig. 2.
Metabolic maps. The metabolic pathways of glycolysis, fatty acid β-oxidation and the tricarboxylic acid cycle are redrawn from the Kyoto Encyclopedia of Genes and Genomes (KEGG). For clarity the respiratory chain is not shown in its entirety, instead only subunits detected by DIGE are highlighted. Orange boxes display the common name of each enzyme, the adjacent boxes detail protein spots matched to this UniProt Rattus ID by LC–MS/MS analysis. A ‘heat map’ colouring system is used to display proteins that were significantly more abundant in HCR (green) or LCR (red) groups (Table 4).

