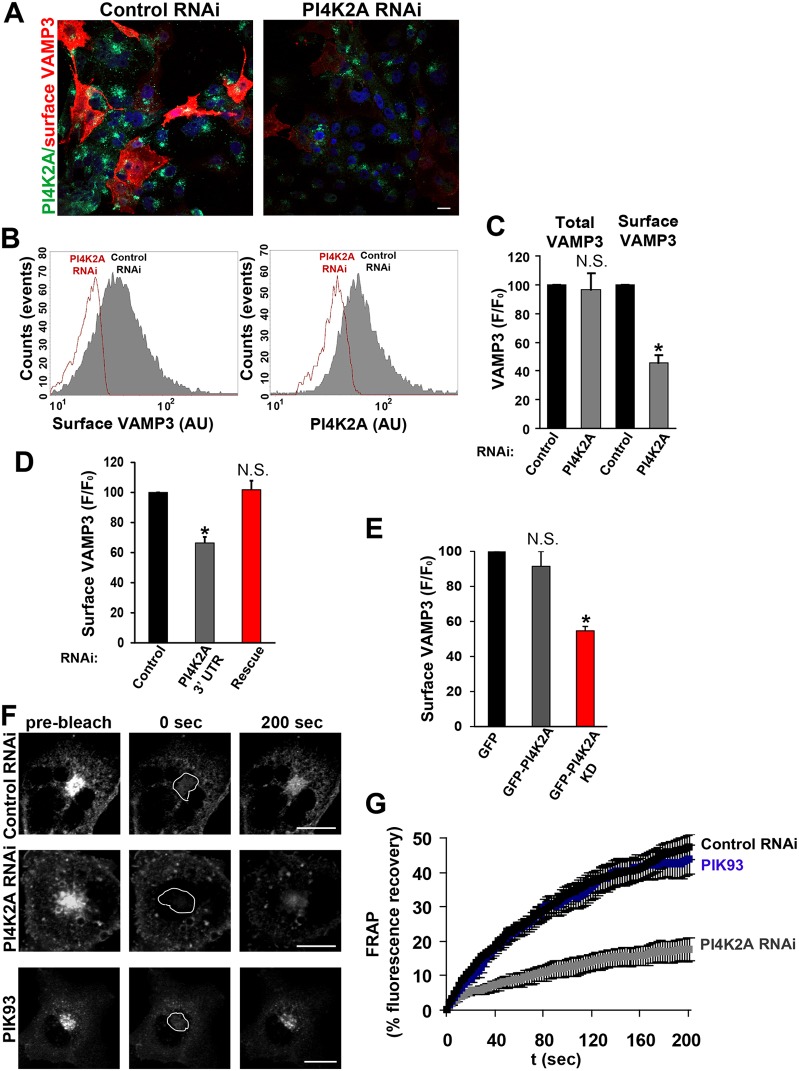
Fig. 4.
VAMP3 levels on target membranes depend on PI4K2A. (A–D) VAMP3–HA was expressed in control or PI4K2A siRNA-treated cells, followed by fixation and immunostaining against HA epitope under non-permeabilizing conditions. Cells were then permeabilized, stained with an antibody against PI4K2A (A–D) and DAPI (A), for analysis either by confocal microscopy (A) or flow cytometry (B–D). Cell-surface levels of VAMP3 were reduced in PI4K2A knockdown cells (red) in comparison to control knockdown (gray) (n = 10,000 cells). (C) Surface or total levels of VAMP3 in control siRNA-treated cells (black) were compared to gated cells showing >80% PI4K2A knockdown (grey). Results are mean±s.e.m. (n = 5; 10,000 cells per sample). *P<0.05 (two-tailed Student's t-test), N.S., not statistically significant (P = 0.77). (D) Reduced cell-surface levels of VAMP3 in PI4K2A knockdown cells (gray) were rescued by expression of PI4K2A–GFP (red) to levels that did not show statistical significance in comparison to the control knockdown (black) as determined by one-way ANOVA. *P<0.05; N.S., not statistically significant (n = 4; 10,000 cells per sample). (E) VAMP3 surface levels in cells transfected with VAMP3–HA and either GFP only (black), PI4K2A–GFP (gray) or the PI4K2A–GFP kinase dead (KD) mutant (red) were determined by flow cytometry. Overexpression of catalytically dead, but not the wild-type PI4K2A, induced a significant decrease in cell surface levels, based on one-way ANOVA. *P<0.05; N.S., not statistically significant (n = 4; 10,000 cells per sample). (F,G) VAMP3 fluorescence recovery was recorded in COS-7 cells transfected with GFP–VAMP3 after 2-day treatment with control siRNA (black, n = 27) or siRNA directed against PI4K2A (gray, n = 32), or 16 h incubation with 100 nM PIK93, an inhibitor of PI4KB (blue, n = 29). The outlined area in F represents the area bleached. Only PI4K2A knockdown induced a substantial delay in fluorescence recovery. FRAP measurements represent mean±s.e.m. for three independent experiments (see Materials and Methods). AU, arbitrary units. Scale bars: 10 µm.

