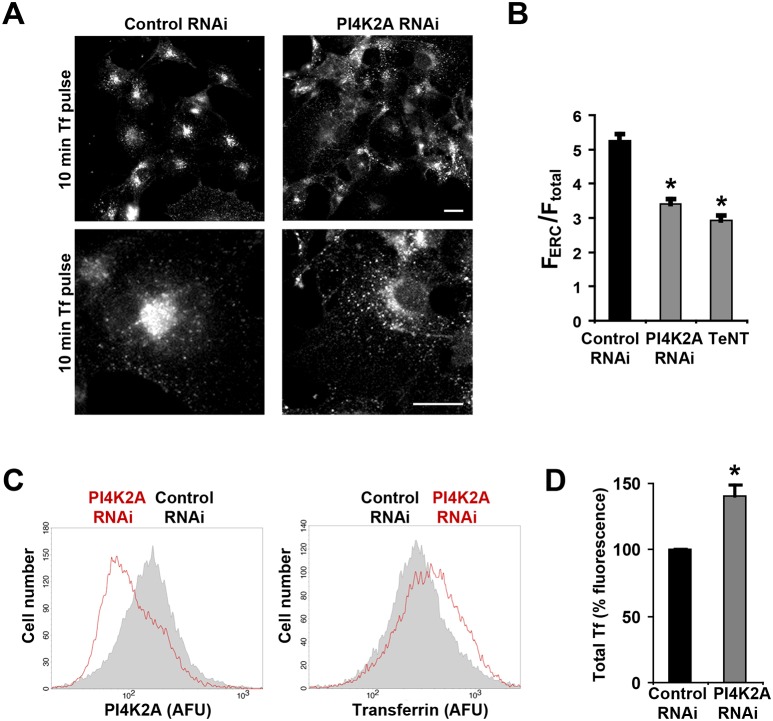
Fig. 7.
TfR delivery to the ERC and rate of recycling are reduced upon PI4K2A depletion. After treatment of COS-7 cells with control siRNA or siRNA directed against PI4K2A, cells were serum-starved for 30 min, then incubated with Alexa-Fluor-488-conjugated transferrin for 10 min and either fixed (A,B) or chased in complete medium for 30 min prior to fixation in 4% paraformaldehyde (C,D). PI4K2A knockdown (A, right panel) impedes delivery of transferrin to the ERC in comparison to the control siRNA-treated cells (A, left panels). (B) Appearance of transferrin in the perinuclear ERC in cells treated with siRNA oligonucleotides, shown in A, or transfected with TeNT. The ratio of transferrin fluorescence in the ERC (FERC) and total fluorescence (Ftotal) was determined as described in the Materials and Methods. Shown are ratios of mean+s.e.m. fluorescence values (n = 50). Statistical significance was determined by one-way ANOVA analysis. *P<0.05 for control versus PI4K2A knockdown and control versus TeNT). (C) Total levels of internalized transferrin, as determined by flow cytometry. Following fixation, cells were incubated with a rabbit polyclonal antibody against PI4K2A. Graphs depict endogenous levels of PI4K2A and total levels of transferrin following a 30 min chase in a representative experiment (n = 3). (D) Total intracellular levels of internalized transferrin, as described in C, in cells gated for a PI4K2A knockdown efficiency of >80%. Graph represents mean±s.e.m. fluorescence intensity (n = 3 experiments, 10,000 cells per sample). AFU, arbitrary fluorescence units. Scale bars: 10 µm.

