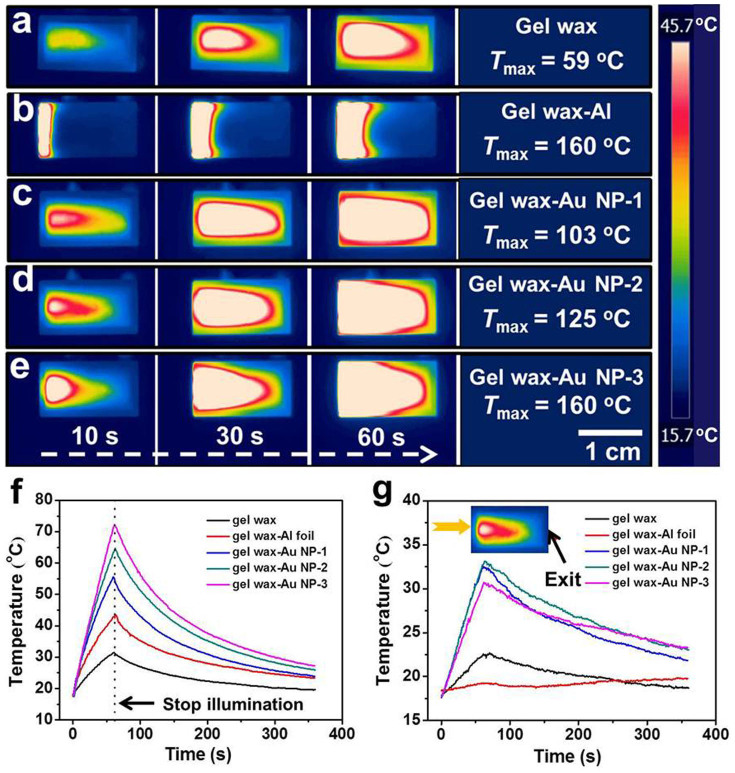
Figure 5. Time-sequential thermal IR images and temperature profiles of thermal storage materials under solar illumination.
IR images of (a) neat gel wax; (b) gel wax-Al foil; (c) gel wax-Au NP-1; (d) gel wax-Au NP-2; (e) gel wax-Au NP-3. (f) Average temperature profile. (g) Temperature profile of thermal storage materials at the light exit side. The inset shows a typical IR image where the temperature value was analyzed as the point in the light exit side of the cuvette.

