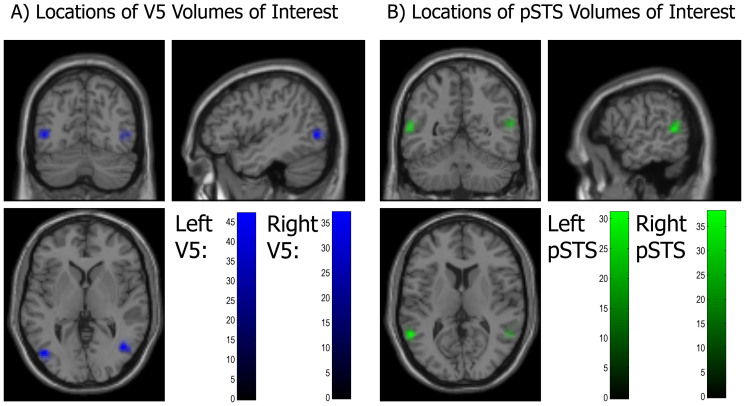
Figure 3.
(A) Brain map showing the left and right V5 VOIs. The colour gradient bar indicates how many participants had the mean of their extracted voxels at a given location. (B) Brain map showing the left and right pSTS VOIs. The colour gradient bar indicates how many participants had the mean of their extracted voxels at a given location.

