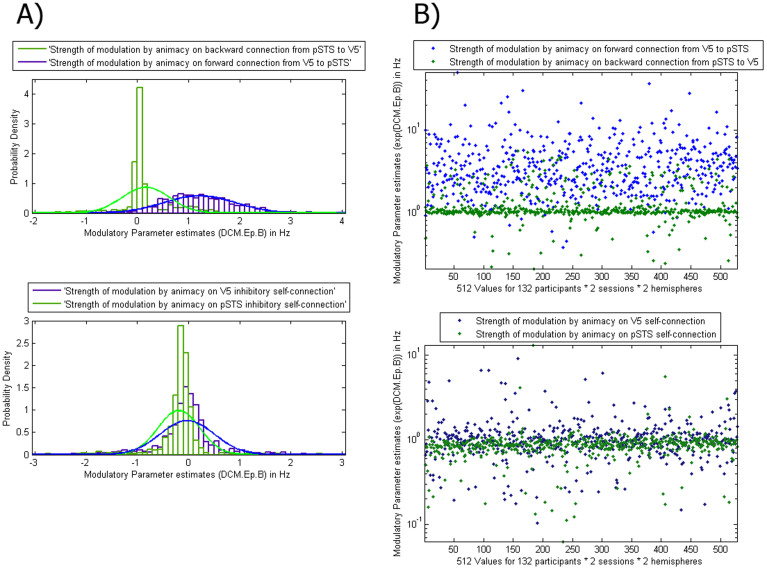
Figure 4.
(A): Probability densities functions of parameter estimates for individual participants showed how strongly (self-)connections were modulated by animacy across participants, hemispheres and sessions. Upper Panel: The forward connection from V5 to the pSTS was more strongly modulated by animacy than the homologue backward connection. Lower Panel: The intrinsic self-connections of the pSTS was significantly lower than V5 and one can clearly see that the inhibitory self-connection in the pSTS has decreased towards zero consistently more than the inhibitory self-connection in V5. In other words, with the pSTS was no longer inhibited, this caused the pSTS activation observed in the Animate > Inanimate contrast. Figure 4 (B): Here the same data as in Figure 4A are plotted, showing all the different data points to highlight the consistency of the results.

