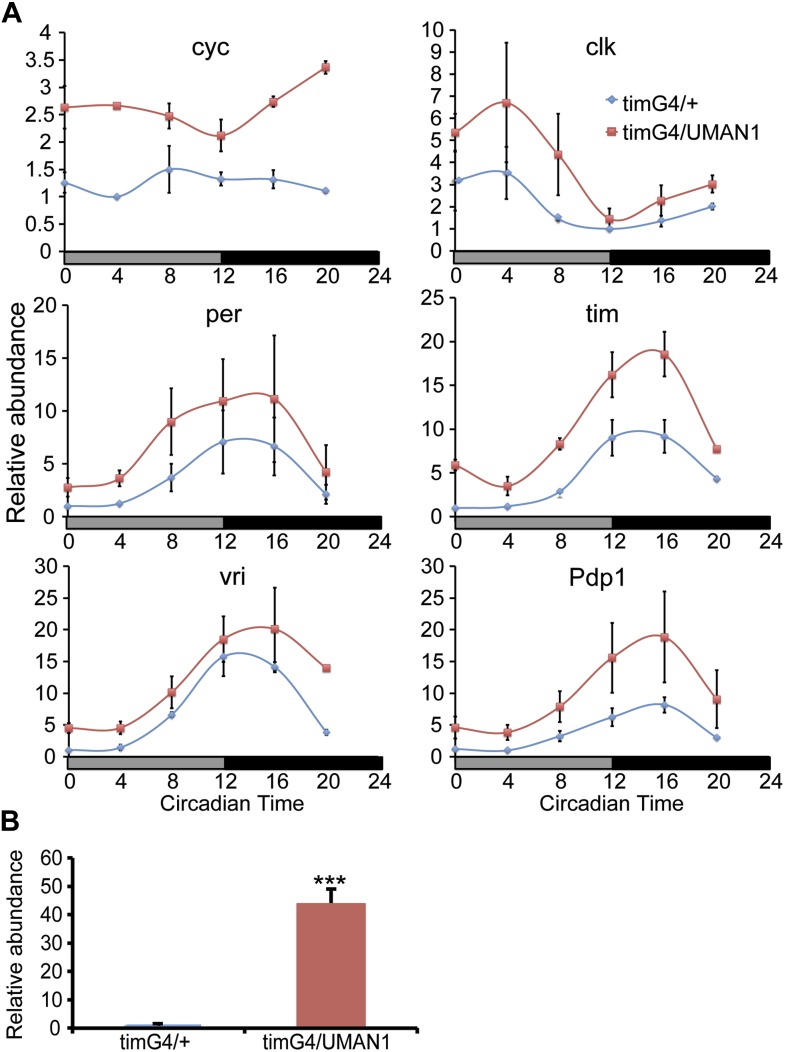
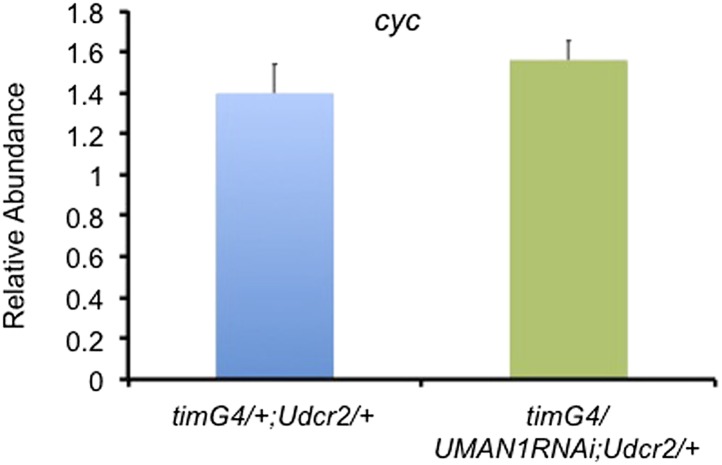
Figure 5. MAN1 increases cyc mRNA levels.
(A) Plots of relative mRNA abundance vs CT for clock genes from whole head extracts of timGAL4/+ and timGAL4/UASMAN1 flies during the first day of DD determined by qRT-PCR (n = 2). Gray box indicates subjective light period and black box indicates dark period. Significant effect of genotypes (Two-way ANOVA) were found for cyc (p = 0.0278) and tim (p = 0.0161). For each time series, the value of the lowest time point was set to 1. (B) Plot of relative mRNA abundance for MAN1 from whole head extracts of timGAL4/+ and timGAL4/UASMAN1 flies determined by qRT-PCR (n = 6, Student's t test, ***p < 0.001). The value of timGAL4/+ in one experiment was set to 1. Error bars represent SEM.


