. 2014 Sep 2;3:e02981. doi: 10.7554/eLife.02981

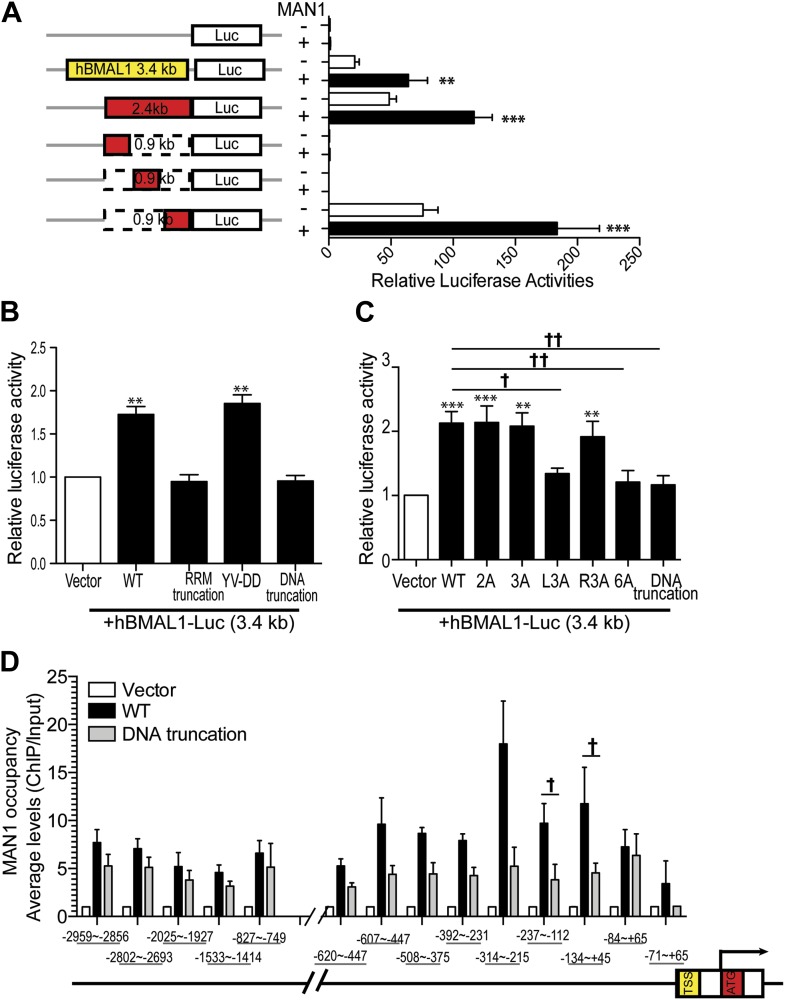
Figure 8. MAN1 binds to the BMAL1 promoter to enhance its transcription.

(A) Luciferase activities of deleted hBMAL1-promoter constructs in the absence or presence of MAN1 expression vectors. n = 3, Student's t test, **p < 0.01, ***p < 0.001. (B and C) Luciferase activities of the 3.4 Kb hBMAL1-Luc in the presence of MAN1 constructs as indicated. n = 3, **p < 0.01, ***p < 0.001 compared to control; †p < 0.05; ††p < 0.001 compared to WT MAN1. (D) ChIP analysis of MAN1 (WT or DNA binding truncation) for 14 segments of hBMAL1 promoter region. Data represent pull-down relative to input. n = 6, †p < 0.05, compared to WT MAN1. One-way ANOVA with Newman–Keuls test. All data are presented as ratio of means ± SEM.

DOI: http://dx.doi.org/10.7554/eLife.02981.018

Figure 8.

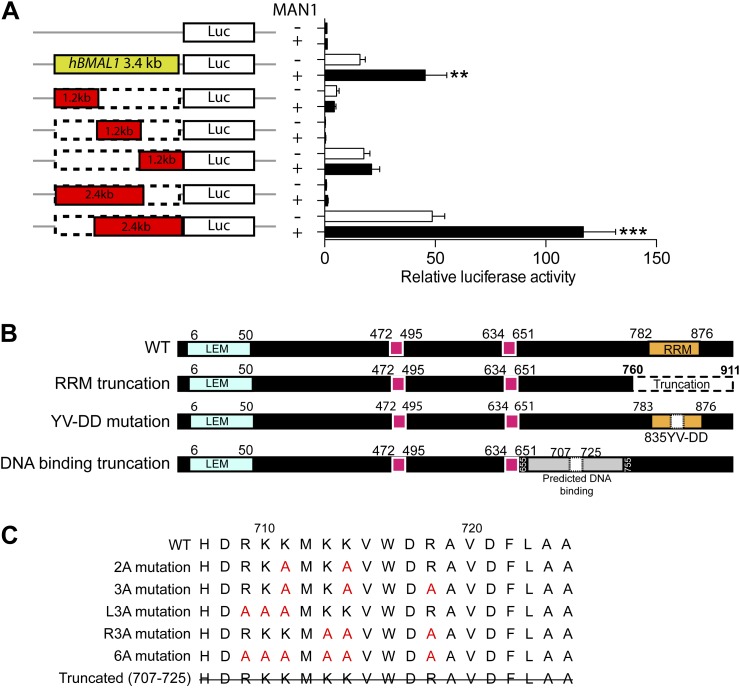
Figure 8—figure supplement 1. Domain-specific interactions between MAN1 and the hBMAL1 promoter.

Figure 8—figure supplement 1.

(A) Schematic representation of the indicated constructs generated from the 3.4 kb hBMAL1 promoter and cloned into the luciferase reporter vector pGL3. Histogram of luciferase activity in HEK293 cells transfected with the deleted hBMAL1 promoter constructs in the absence or presence of MAN1 expression vectors. Cells transfected for 48 hr and relative luciferase activities measured in extracts and normalized to Renilla luciferase activities. Activities (relative luciferase activity) are shown on the y-axis. Values are means ± SEM, n = 3, Student's t test, **p < 0.01, ***p < 0.001 compared to control. (B) Schematic representation of the deletion constructs generated from the MAN1 expressing construct. (C) Sequences of constructs with point mutations generated from the MAN1 expressing construct.