
Figure 1. Voxel-wise cerebral perfusion t map comparing mutation carriers with noncarriers, mutation carrier group-wise PiB-PET, and overlay of perfusion t map and PiB-PET.
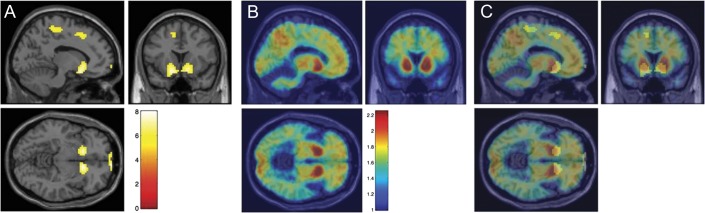
(A) Two-sample t test with no covariates demonstrating areas of decreased CBF in mutation carriers compared with noncarriers; family-wise error p < 0.05, cluster level of 30; color bar represents t values for significant voxels; Montreal Neurological Institute coordinates −11, 20, −8. (B) Mutation carriers (14) group composite amyloid PET demonstrating high bilateral striatal amyloid deposition; color bar represents standardized uptake value ratio 50–70 values. (C) Composite overlay of voxel-wise CBF map (A) and group-level amyloid deposition demonstrating the anatomical colocalization of the decreased CBF in the bilateral striatum where cerebral amyloid density is highest. CBF = cerebral blood flow; PiB = Pittsburgh compound B.