
Figure 1.
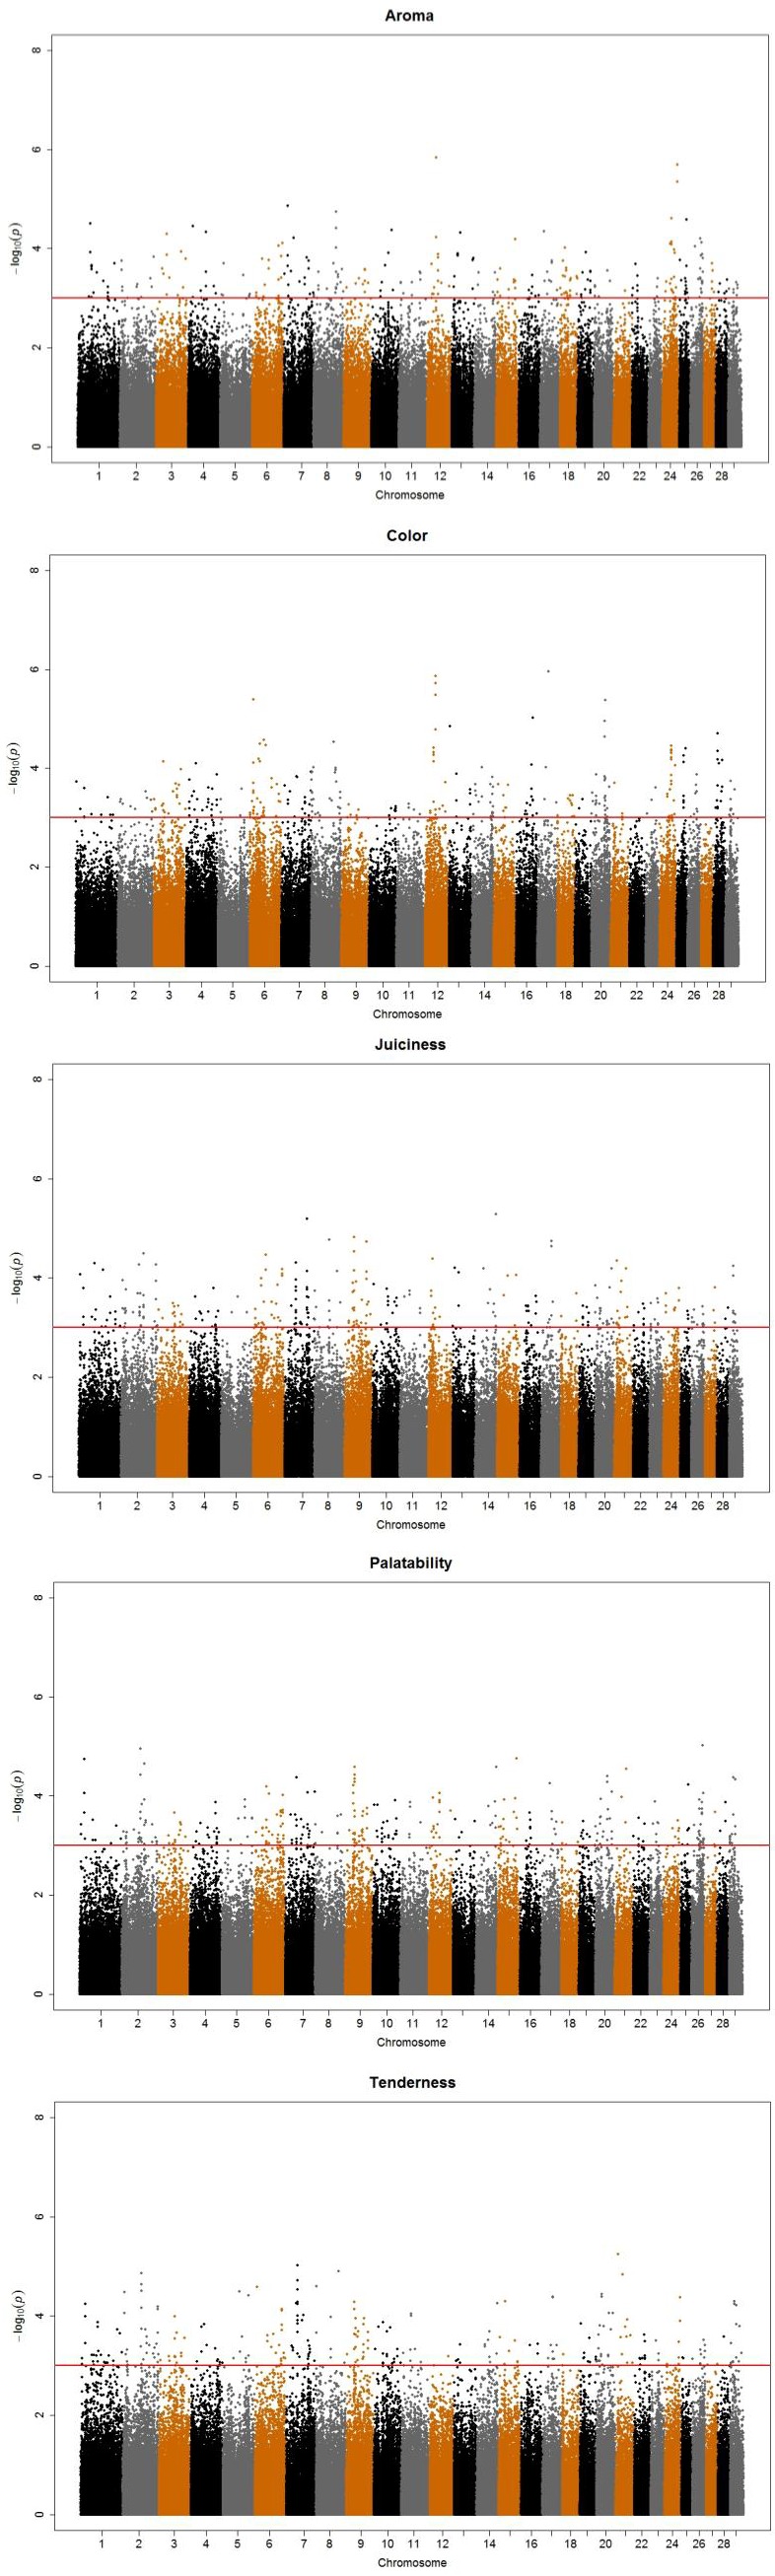
i) The Manhattan plots for the five sensory evaluation results after genome-wise association analyses. X-axis indicates chromosome number and Y-axis p values (-log10P) from the F test statistics for each single nucleotide polymorphism. ii) The Manhattan plots for the five sensory evaluation GWAS results after genome-wise association analyses. X-axis indicates chromosome number and Y-axis p values (-log10P) from the F test statistics for each single nucleotide polymorphism.