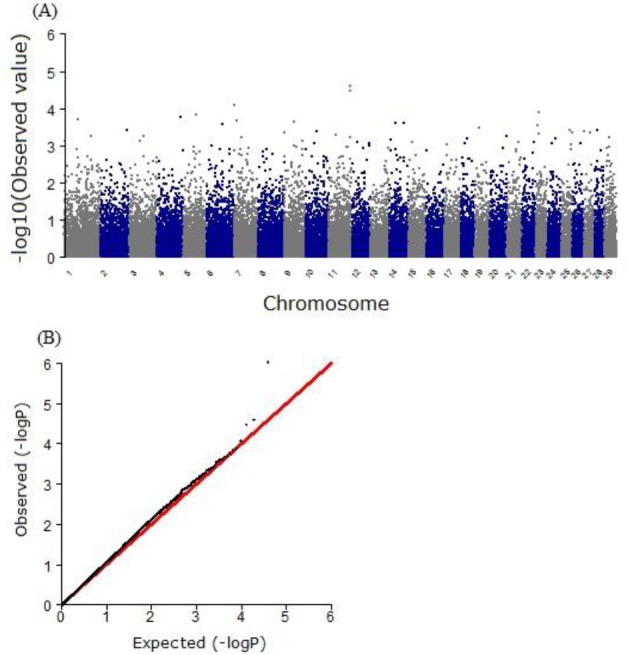
Figure 1.

Association of 38,291 SNPs with the WB shear force. (A) Manhattan plot. (B) Quantile-quantile plot. The red line represents the 95% concentration band under the null hypothesis of no association. The black dot represents the p values of the entire study. SNP, single nucleotide polymorphism; WB, Warner-Bratzler.
