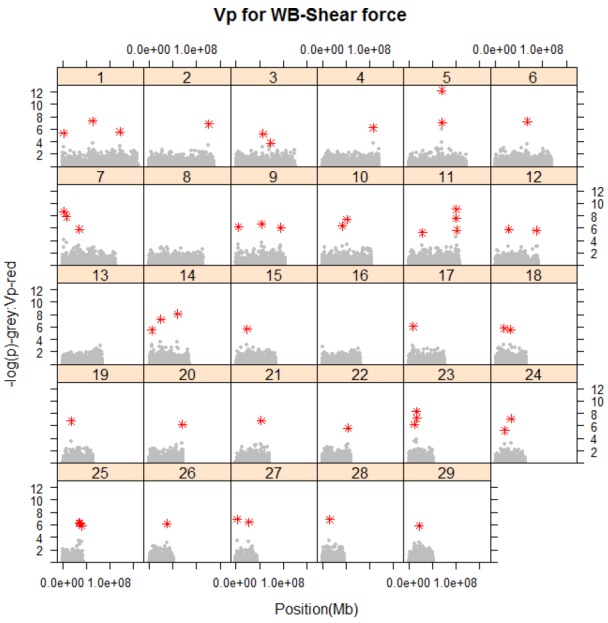
Figure 2.

The -log p value for the association between SNP and WB shear force (grey) and phenotypic variance (red) that significant SNPs (p<0.001) account for in the single marker regression analysis. SNP, single nucleotide polymorphism; WB, Warner-Bratzler.
