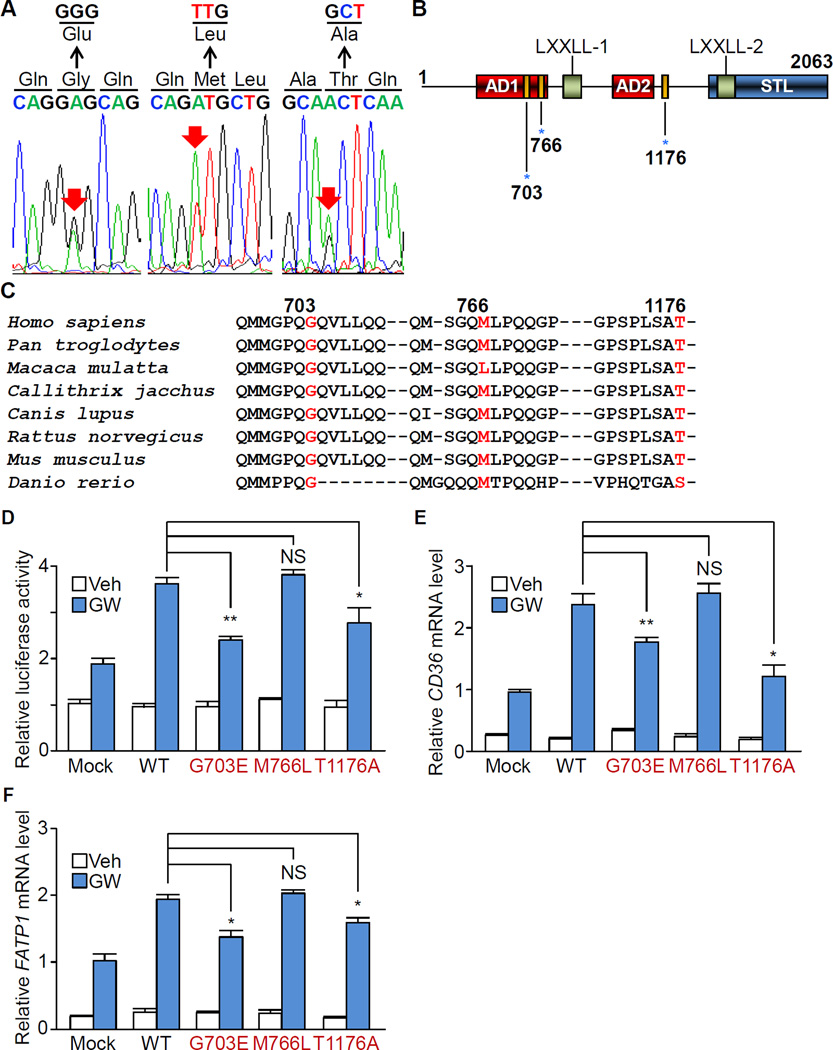
Figure 4. Non-synonymous mutations of NCOA6 in human iDCM patients result in impaired PPARδ activity.
(A) DNA sequences of NCOA6 exons that were obtained from iDCM patients. Red arrows indicate mutation sites.
(B) Schematic representation of the human NCOA6 protein. AD, activation domain; STL, serine, threonine and leucine rich region; blue asterisks, mutation sites.
(C) NCOA6 amino acid sequence alignment across 8 species. Numerals indicate the positions of the amino acid mutations (red) in patients.
(D–F) Relative luciferase activity of PPRE (D) and gene expression levels of CD36 (E) and FATP1 (F) in WT and mutant NCOA6-transfected AC16 cells with or without treatment with GW501516 for 48 h. Graphs show the means of triplicate experiments ± s.d.; NS, not statistically significant; *P < 0.05; **P < 0.01. See also Figure S4 and Table S1.

