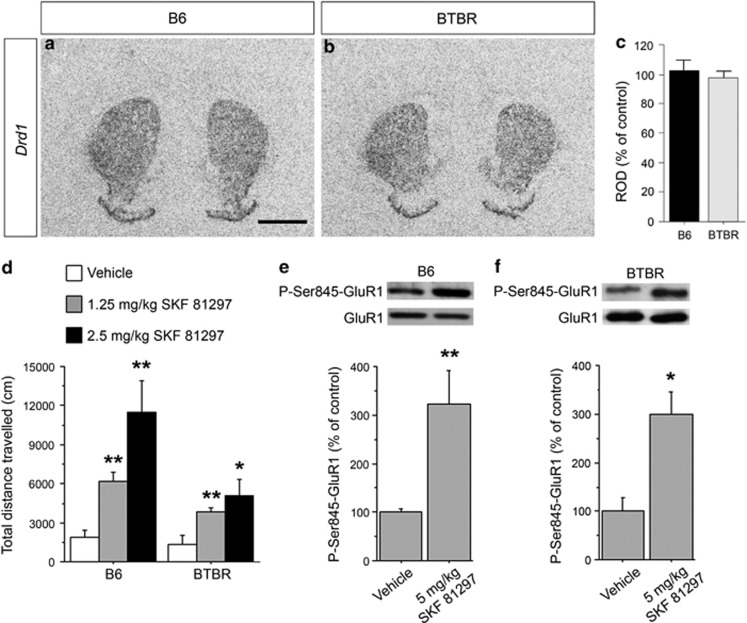
Figure 3.
Preserved Drd1-mediated motor stimulation and signalling in BTBR mice. Representative images of coronal sections showing Drd1 mRNA expression in the striatum of B6 (a) and BTBR (b) animals (scale bar, 1.5 mm). (c) Histogram showing Drd1 mRNA levels in BTBR animals (n=7) obtained after densitometric quantification of autoradiograms expressed as percentage variation as compared with B6 control animals (n=4). (d) Motor activity induced by 1.25 and 2.5 mg kg−1 SKF 81297 in B6 (vehicle, n=6; 1.25 mg kg−1, n=7; 2.5 mg kg−1, n=6) and BTBR animals (vehicle, n=5; 1.25 mg kg−1, n=6; 2.5 mg kg−1, n=6). Locomotion is expressed as the total distance travelled (in cm). *P<0.05, **P<0.01, compared with vehicle-treated group within strain (Fisher's post hoc analysis). P-Ser845-GluR1 protein levels determined by western blotting in the striatum of B6 (e) and BTBR mice (f) treated with 5 mg kg−1 SKF 81297 (B6, n=8; BTBR, n=3) or vehicle (B6, n=9; BTBR, n=3). The top panels in e and f show representative blots comparing the different strains. *P<0.05, **P<0.01, compared with vehicle, Student's t-test (f and e, respectively). All values are expressed as mean±s.e.m.

