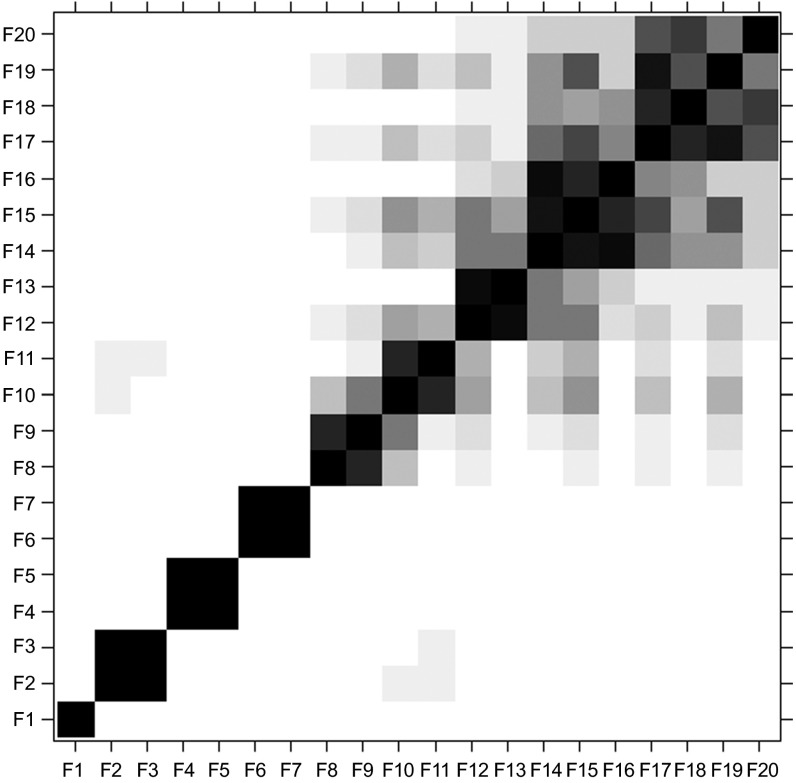
Figure 4.
ω-correlation matrix, the F values represent oscillating components within a year (i.e. F6 is the 6-month bi-annual component). The level of correlation can be found by finding the component of interest along the X-axis and looking up the Y-axis to see where it corresponds with other rainfall components. Large values of ω-correlation between reconstructed components indicate that they should possibly be gathered into one group and correspond to the same component in SSA decomposition. The matrix uses a 20-grade gray scale from white to black corresponding to the absolute values of correlations from 0 to 1 (with 0 being no correlation and 1 being absolute correlation).

