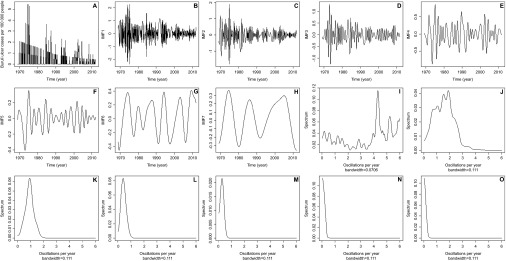
Figure 5.

Monthly time series and EMD of Buruli ulcer cases per 100 000 people. (A) Monthly time series of Buruli ulcer cases per 100 000 people from 1969 to 2012. (B) First IMF. (C) Second IMF. (D) Third IMF. (E) Fourth IMF. (F) Fifth IMF. (G) Sixth IMF. (H) Seventh IMF. Periodograms for (I) first IMF showing a high level of variation across the spectra and therefore, should be considered white noise; (J) second IMF which has its highest power at two cycles per year; (K) third IMF with its highest power at one cycle per year; (L) fourth IMF with the highest power approximately at one cycle every 2 years; (M) fifth IMF with the highest power approximately at one cycle every 4 years; (N) sixth IMF with a low level of cycles representing very long-term trends; (O) seventh IMF also representing long-term trends.
