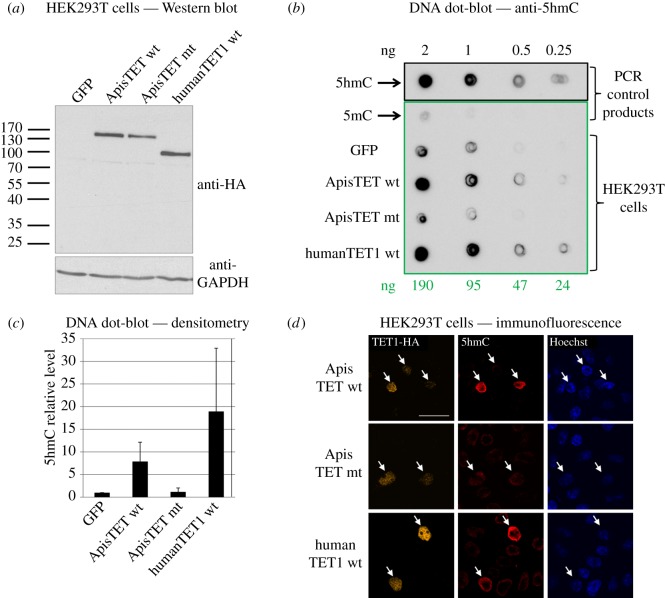
Figure 3.
In vitro expression of AmTET in human embryonic kidney (HEK293T) cells. (a) Western blot analysis of the expression levels of TET-HA proteins were analysed 48 h after transfection. GAPDH level is a protein loading control. (b) Genomic DNA from these cells was isolated and dot-blotted with specific anti-5hmC antibody. About 24–190 ng of each genomic DNA and the same amounts of PCR product with dCTP swapped for d5mCTP were used for this experiment. About 0.25–2ng of PCR product with dCTP swapped for d5hmCTP was used as a positive control. Signal obtained from cells expressing wild-type TETs is stronger than from cells expressing GFP or a catalytically inactivated honeybee TET. (c) Data obtained from three independent dot-blots were quantified by densitometry. Results were normalized with DNA obtained from cells expressing GFP (set as 1). (d) TET localization and 5hmC presence in transfected HEK293T cells was analysed via immunofluorescence. HA-tagged TET proteins (orange) localize mainly in the nuclei (blue). Cells that express catalytically competent TETs also have more 5hmC (red). The increase of hydroxymethylation in transfected cells is statistically significant (the p-value of the null hypothesis is 0.054). Scale bar, 20 µm. The arrows point to cells with TETs. The image represents a single slice of a confocal stack. The ring for 5hmC staining is expected because of the penetration depth of denaturation affecting the 5hmC detection. In contrast, both TET detection and DAPI staining do not require denaturation of the DNA, and hence do not show the same ring feature. Although HEK293 cells have very low endogenous TET and 5hmC, their residual amounts result in a small background.

