
Figure 3.
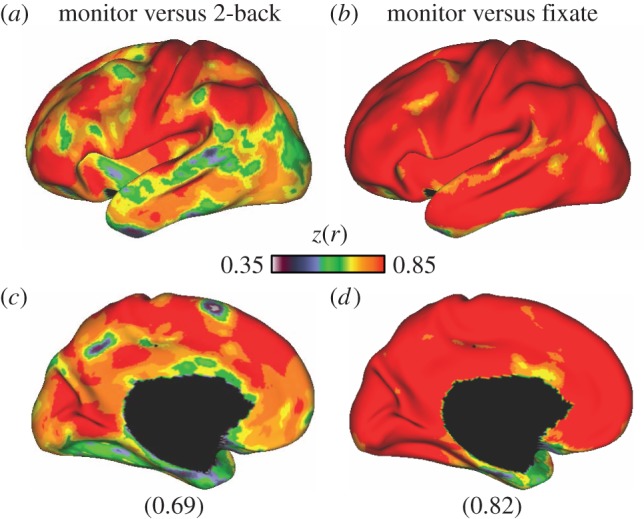
Global coupling profiles are substantially similar across tasks. Across all possible pairs of tasks (91 pairs), the lowest and highest mean correlation of whole-cortex global connectivity profiles ranged between 0.69 and 0.82. (a,c) The global connectivity correspondence between the monitor and 2-back (hard) tasks, the task pair with the lowest global coupling correspondence (0.69). (b,d) The agreement between the monitor and fixate tasks, the pair with the highest (0.82) agreement. Lateral surface views of the left hemisphere are shown on (a,b) and medial views are at (c,d). A large proportion of the correlation structure is shared, even across these distinct task states.