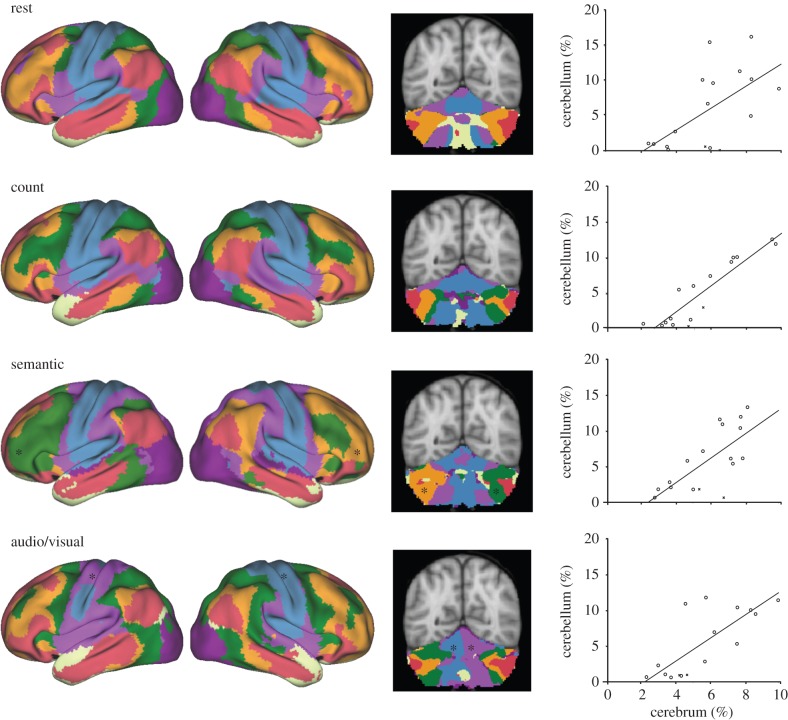
Figure 9.
Cerebro-cerebellar network organization is conserved across task states. A roughly homotopic relationship exists between the proportion of the cerebral cortex and the cerebellum assigned to each network. The top row re-plots data from [70], demonstrating this relationship for eyes open rest data acquired from N = 1000 participants. A similar correlation persists in all 14 tasks measured in this study, though the details of the network configurations change in each case. (Bottom rows) Representative examples of homotopic scaling across Passive, Word and Sensory task variants. Left column shows the lateral views of the 7-network cerebral cortical parcellation for each task. Middle column shows a representative coronal slice of the corresponding cerebellar parcellation. Right column plots percentage of cerebellum (volume) against percentage of cerebrum (surface area). Points in scatter plot represent each of the 17 networks, following [70]. Black asterisks indicate networks that formed splits between homotopic regions in both the cerebral and cerebellar cortices for particular tasks.

