
Figure 3.
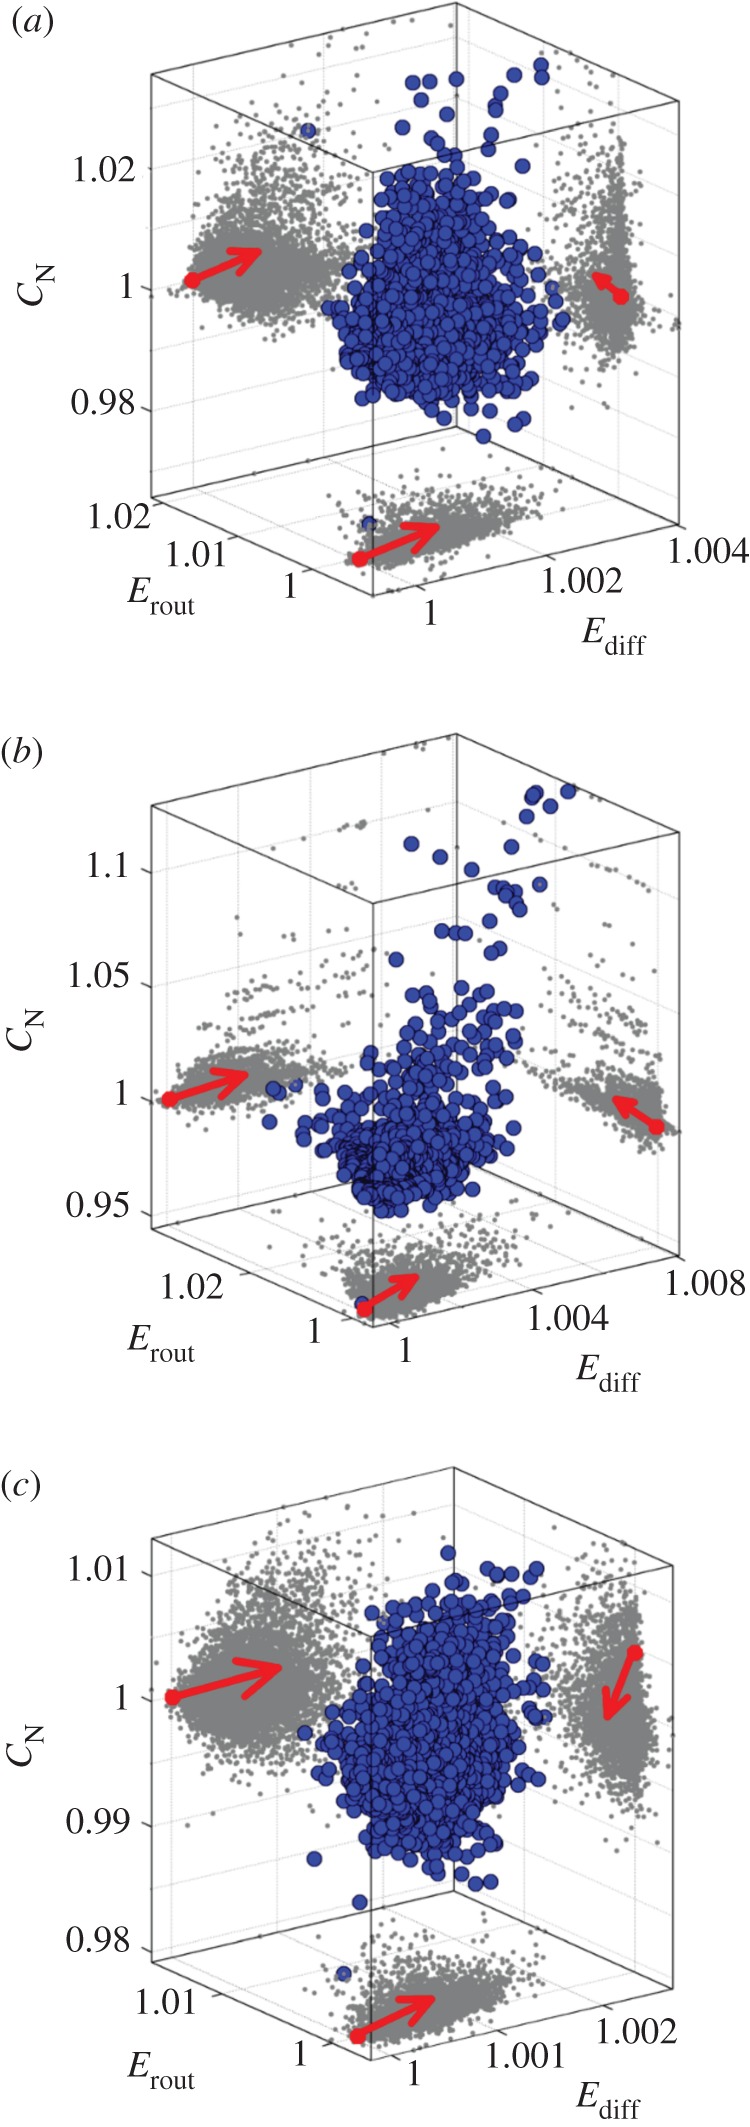
Population of proximal network elements of (a) LAU1, (b) LAU2 and (c) UTR networks, respectively. Every blue dot shows the location of a network that was created by applying three rewiring steps to the respective empirical network. Grey dots show the two-dimensional projections onto the distinct planes of the morphospace. Red dots at the origin of the arrows indicate the projections in each two-dimensional plane of the three-dimensional coordinates (1, 1, 1), which correspond to the location of the empirical networks within the respective morphospace. Arrows point towards the preferred direction in which proximal networks are located in each plane.