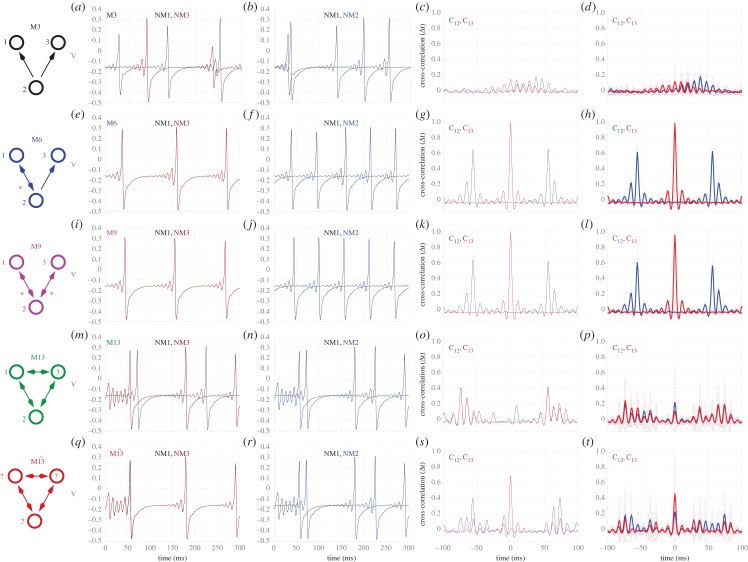
Figure 1.
Synchronization in motifs of neural mass models. Dynamics of common driving motif M3 (a–d), common driving motifs with resonance pairs (tagged with red stars) M6 and M9 (e–l), and common driving motifs with frustrated resonant sources M13 and  (m–t) with delay τ = 10 ms and coupling strength c = 0.01. Motif M13 has node labels determined beforehand, whereas motif
  has node labels determined a posteriori such that the zero-lag synchronization between nodes 1 and 3 is maximized. First and second columns represent time traces of individual neural mass models (1 and 3, 1 and 2, respectively), whereas the third and fourth columns represent the cross-correlation functions between node pairs of the corresponding single time series and averaged over 40 trials, respectively, with pairs 1–2 in blue and 1–3 in red. (Online version in colour.)

