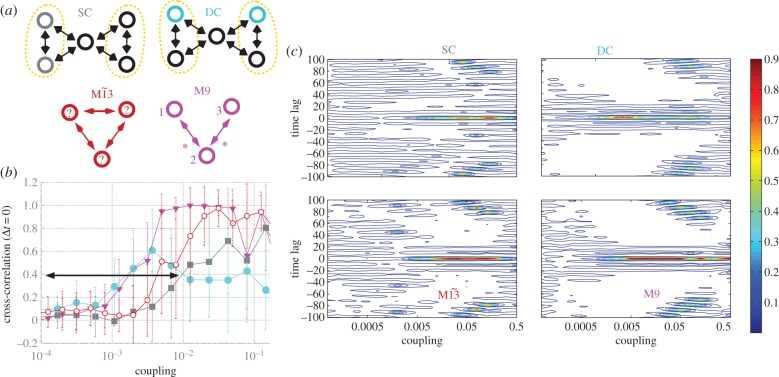
Figure 3.
Zero-lag synchronization from motifs to modular structures. (a) Pairs on minimal modular structure selected from the SC and from DCs can be compared with motifs of three nodes. (b) Zero-lag synchronization of nodes 1 and 3 of motifs M9 and  , and maximum zero-lag synchronization between nodes located at different and SCs of modular structures. Black arrow denotes the range of weak coupling in which the synchronization is stronger between nodes of DCs than nodes of the SC. (c) Contour plot of cross-correlations for varying coupling strength and time lag. Line represents curves along which the cross-correlations have a constant value. White regions correspond to regions between contour lines, and the large white areas represent negative cross-correlation values, as can be seen in figure 1k,l for motif M9 and c = 0.01. Cross-correlation between nodes 1 and 3 on motif M9
  resembles the maximum cross-correlation between DC (SC) nodes. (Online version in colour.)

