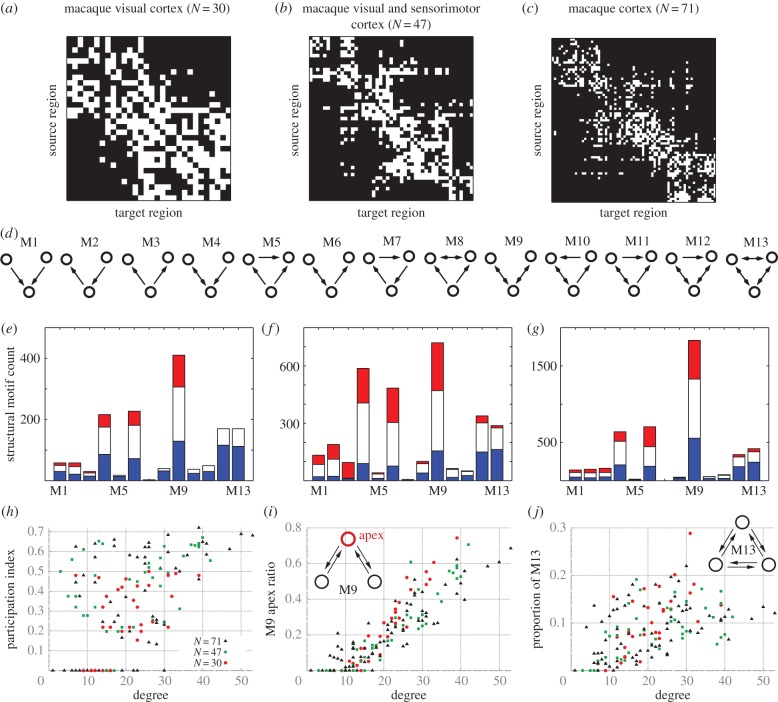
Figure 6.
Motif distribution and modularity in macaque cortical networks. (a–c) Connectivity matrix for the different CoCoMac networks. White (black) squares indicate the presence (absence) of connections in these binary networks. (d) Three-node motifs named as per Sporns & Kötter [15]. (e–g) Structural motif counts (SMC) for each cortical network. The lengths of the bars denote all SMC; blue partitions (bottom) denote SMC with only intra-cluster connections; red partitions (top) denote SMC with only inter-cluster connections; white (middle) partitions denote SMC with both intra- and inter-cluster connections. (h) Scatter plot of participation index (see appendix A) and degree for each region of the three macaque networks. The degree is the sum of the number of inward and outward links. (i) Scatter plot of apex ratio for motif M9 and degree of each region. The apex ratio indicates the incidence of each region occupying the apex position of all motifs M9 in which the region takes part. Hubs (nodes with high degree) exhibit high apex ration for motif M9. (j) Scatter plot of the proportion of counts of motif M13 in which the regions participate and degree of each region. (Online version in colour.)

