
Figure 1.
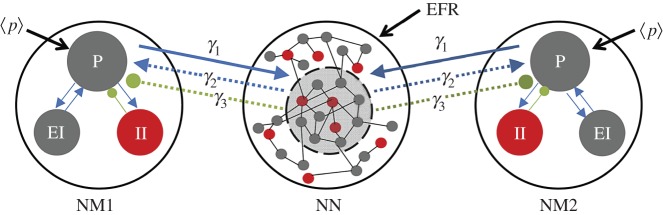
Diagram representing the coupling between different scale-based models. Two groups of neuronal populations, described by neural mass (NM) models, are coupled through a neuronal network (NN). The NMs represent the average dynamics of three coupled neural populations: pyramidal (P), excitatory interneurons (EI) and inhibitory interneurons (II). The NN consists of a set of 4000 excitatory and inhibitory interconnected neurons. Only a subset of neurons of the NN is coupled with the NMs. The coupling strength between the NMs and the NN is given by the three parameters, γ1, γ2 and γ3. γ1 quantifies the coupling from the pyramidal population of the NMs to the NN subpopulation. γ2 and γ3 represent the intensity of the excitatory and inhibitory couplings, respectively, from the NN subpopulation to the NMs’ pyramidal population. (Online version in colour.)