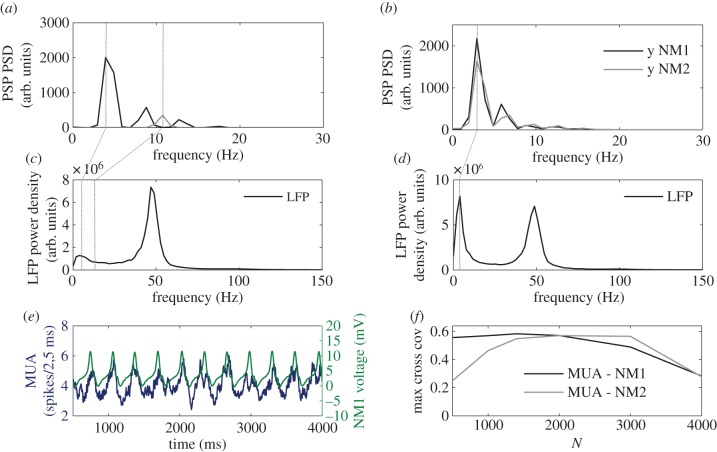
Figure 3.
Effect of coupling on the power spectra of the three neuronal populations. (a) Power spectra of the net PSP y(t) of the NMs in isolation. Primary peaks are tagged with vertical dashed lines at approximately 4.5 Hz and approximately 11 Hz. (b) Power spectra of the net PSP y(t) of the NMs when coupled (k = 1) through a subpopulation of 2000 neurons within the neural network. The common primary peak is tagged with a vertical dashed line at approximately 4 Hz. (c) Power spectrum of the LFP of the NN in isolation. (d) Power spectrum of the LFP when the subpopulation of the NN is coupled (k = 1) to the NM models. Spectral densities are averaged over 20 trials. (e) Time traces of the MUA signal of the NN (blue online, dark grey in print, left axis) and the voltage of NM1 (green online, light grey in print, right axis). The MUA is calculated here using a sliding window of length 50 ms. (f) Correlation between the MUA and voltage signals shown in panel (e) as a function of the number of neurons from the central NN involved in the communication between the two NMs. (Online version in colour.)

