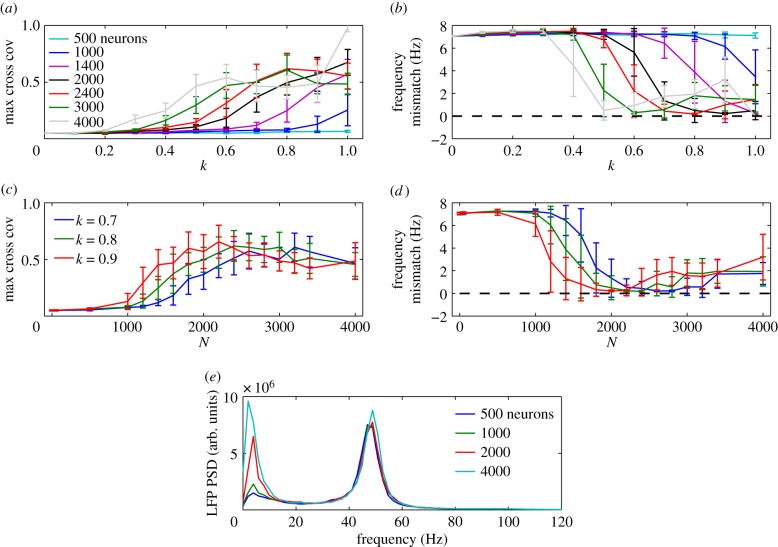
Figure 5.
Maximum cross covariance (a) and frequency mismatch (b) between the NM average PSPs as a function of coupling strength k, for various values of the size N of the subpopulation of the NN that mediates the coupling. (c,d) Same quantities as a function of N for various values of the inter-scale coupling strength k. (e) Spectral power density of the LFP of the whole NN, when the NMs are connected with NN subpopulations of various sizes (k = 0.9). All results are averaged over 20 trials. (Online version in colour.)

