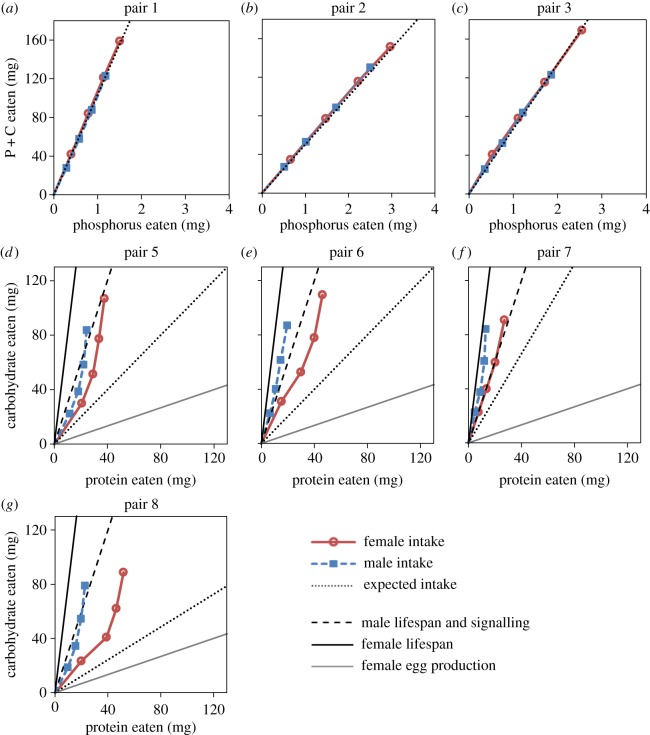
Figure 3.
Cumulative intakes over 72 h intervals for (a–c) phosphorus relative to protein + carbohydrate (P + C) intake in experiment 2, and (d–g) protein relative to carbohydrate intake in experiment 3 for males (blue) and females (red). Black dotted lines indicate the intake ratio expected if crickets were eating foods indiscriminately. Black dashed, black solid and grey solid lines indicate the intake ratios in experiment 1 that maximized male lifespan and signalling, female lifespan and female egg production, respectively.

