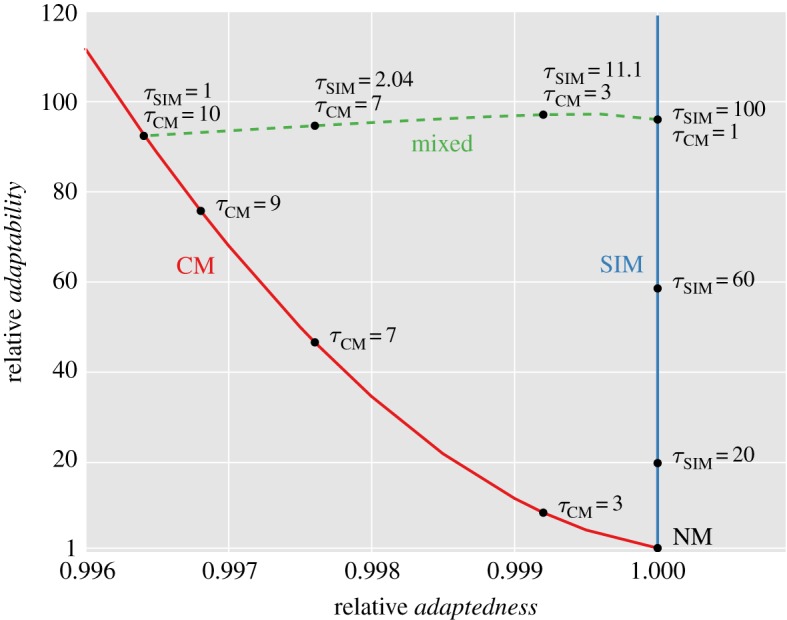
Figure 3.

The trade-off between adaptedness and adaptability. The figure shows the relative adaptedness and the relative adaptability of different mutational strategies in comparison to NM. Adaptedness is defined by the population mean fitness at MSB,  (see the electronic supplementary material, appendix D). Adaptability is defined by the rate of complex adaptation, ν (equations (3.5)–(3.7)). CM increases the mutation rate of all individuals τCM-fold; SIM increases the mutation rate of stressed individuals τSIM-fold; mixed strategies (dashed line) increase the mutation rate of all individuals τCM-fold and of stressed individuals an additional τSIM-fold. SIM breaks off the adaptability–adaptedness trade-off of CM, increasing the adaptability without compromising the adaptedness of the population. Parameters (see table 1): N = 106, U = 0.0004, β = 0.0002, s = 0.05, H = 2,
  . (Online version in colour.)
