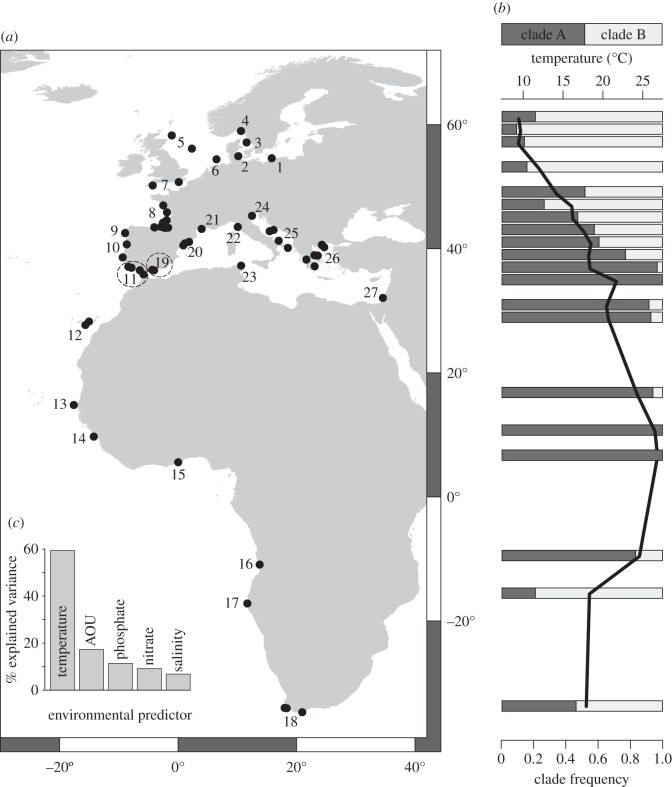
Figure 1.
(a) Locations used for environmental correlates of mitochondrial clades frequencies; numbers correspond to map code in table 1 and the electronic supplementary material, table S1. (b) Climatological sea temperature from World Ocean Atlas 2009 between 0 and 10 m (black line) and clade frequency (clade A, dark grey; clade B, light grey). (c) Importance of environmental variables after hierarchical partitioning analysis; AOU, apparent oxygen utilization.

