
Fig. 1. The Effects of Socioeconomic Status over the Life Course on Body Weight in 2004.
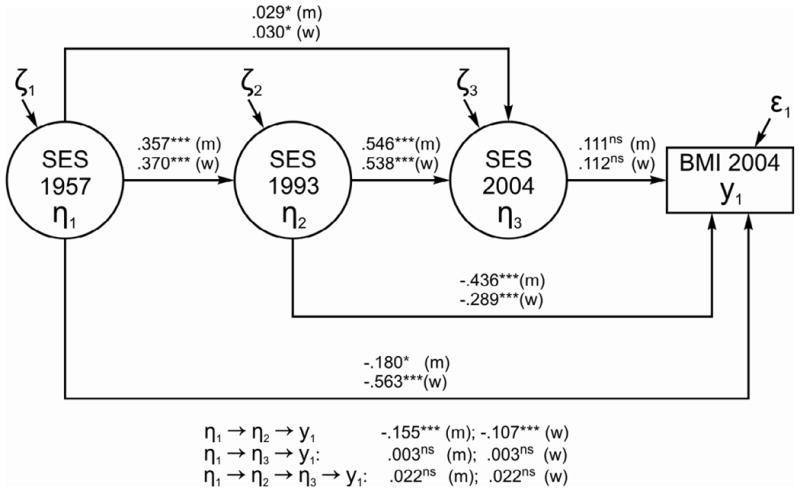
Note: m = men; w = women; ns = not significant at the .05 level. SES = socioeconomic status. BMI = body mass index. *p < .05. ***p < .001.
Official websites use .gov
A
.gov website belongs to an official
government organization in the United States.
Secure .gov websites use HTTPS
A lock (
) or https:// means you've safely
connected to the .gov website. Share sensitive
information only on official, secure websites.
Note: m = men; w = women; ns = not significant at the .05 level. SES = socioeconomic status. BMI = body mass index. *p < .05. ***p < .001.