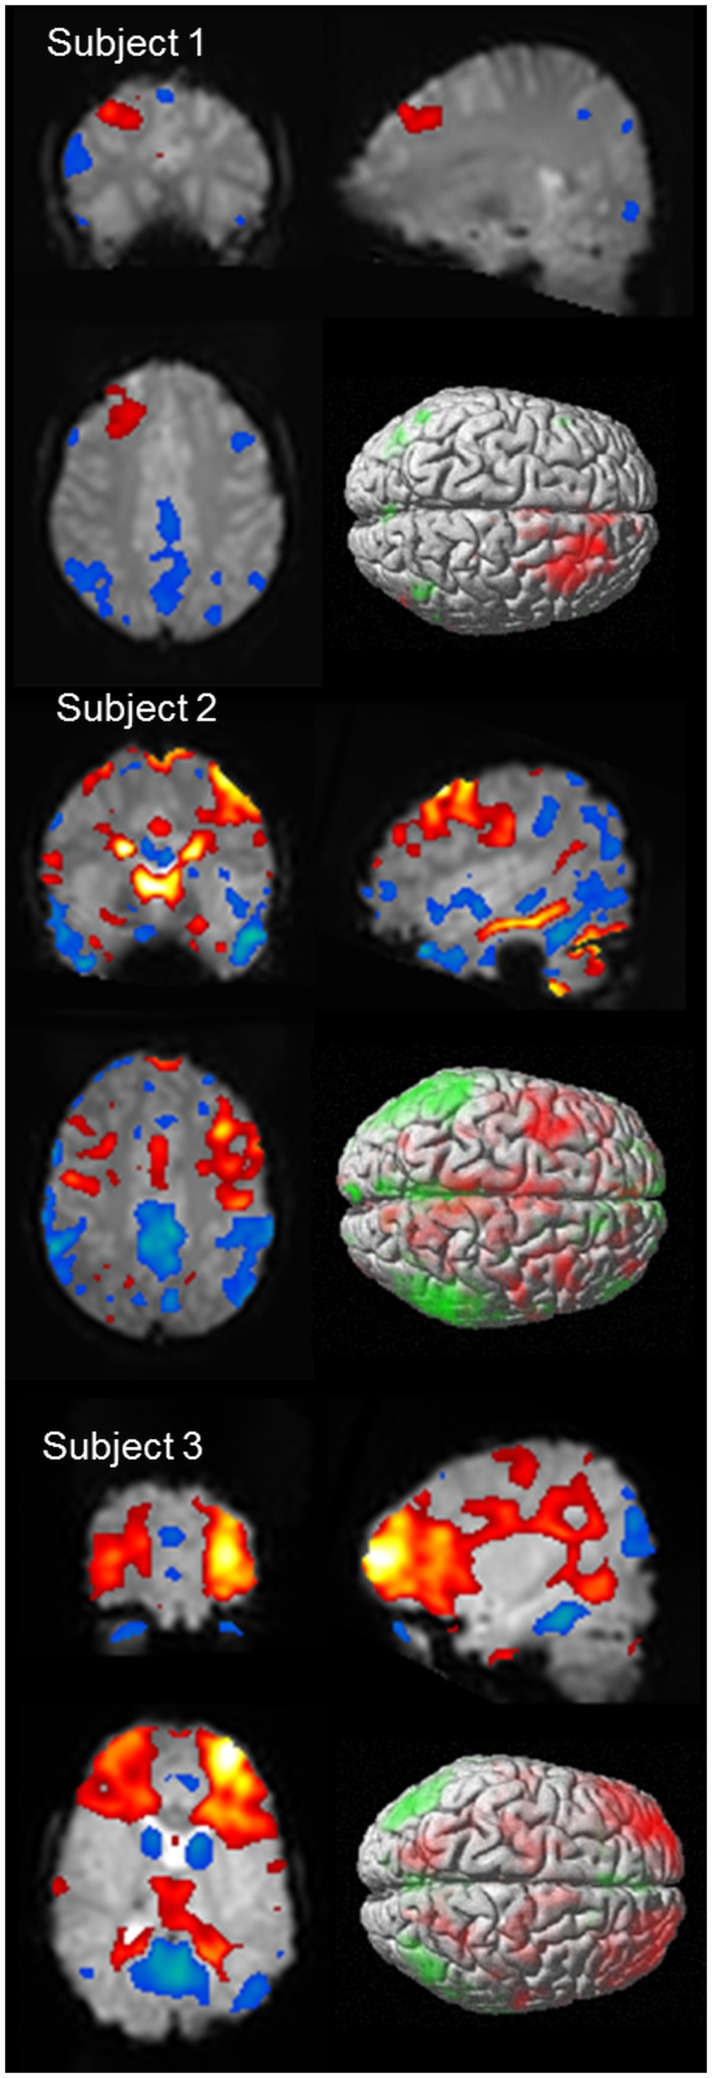
Figure 4.
BOLD signal change for three subjects showing variability of cortical BOLD change (figure previously unpublished). Color maps of positive BOLD (red to white: 0 to +10) and negative BOLD (blue to green: 0 to −10) change superimposed on subjects mean EPI image are displayed in three plains (p < 0.001). A single surface rendered image is also displayed demonstrating the cortical surface involved. Subject 1: 16 years female with onset of AS at age 5 who developed refractory AS and GTCS. EEG-fMRI of 6 (14 s) bursts of interictal activity. Subject 2: 13 years male with onset of AS at age 8 who achieved seizure control on mono-therapy. EEG-fMRI of 11 AS (105 s). Subject 3: 5 years female with AS since 4 who achieved seizure control on mono-therapy. EEG-fMRI of 6 AS (83 s).

