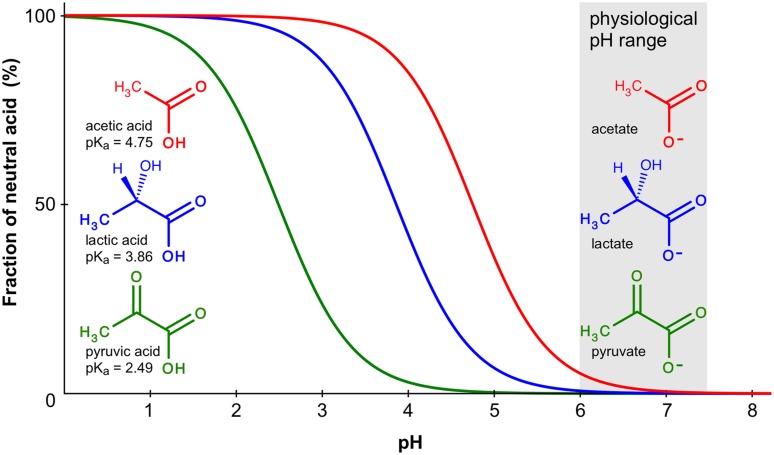
FIGURE 3.
Chemical protonation equilibrium of weak monoacids. The curves indicate the fraction of the protonated, neutral forms of acetic, lactic, and pyruvic acid in a pH range from 0 to 8. Calculations were done using the Hendersen–Hasselbalch equation; pKa values are given at the molecule structures.

