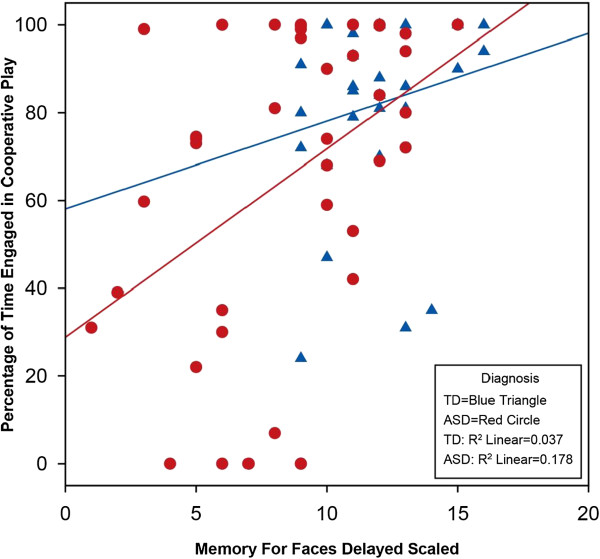
Figure 2.

Scatterplot of associations between Memory for Faces Delayed and Cooperative Play in children with ASD and TD. The Y-axis reflects the percentage of time children with ASD (red circle) and TD (blue triangle) engaged in cooperative play with peers, whereas the X-axis reflects the scaled score from the Memory for Faces subtest. The regression lines show a positive correlation between the variables which is most pronounced in the ASD group.
