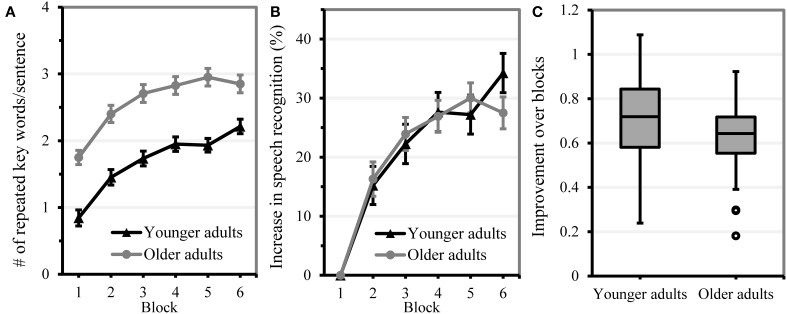
Figure 4.
Performance on the perceptual learning task. Error bars indicate two standard errors from the mean. (A) Mean improvement in speech understanding per age group over block. (B) Improvement in speech understanding performance (in %) relative to baseline level. (C) Box plot of perceptual learning performance in younger and older adults (individual block slopes from the statistical model). More positive slopes reflect more learning.

