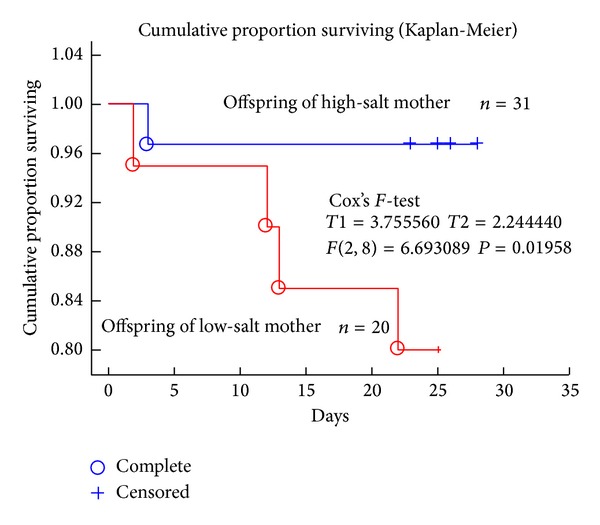
Figure 2.

Cumulative proportion of offspring survival (Kaplan-Meier analysis). Survival prognosis was evaluated from their birth of the rat pups to weaning. Blue circles refer to the death (complete) of pups from high-salt intake mothers; red circles refer to the death (complete) of pups from a low-salt intake mothers. Plus (+), censor. The difference was analyzed by Cox's F-test (T1 = 3.755, T2 = 2.244, F(2, 8) = 6.6930, and P = 0.01958).
