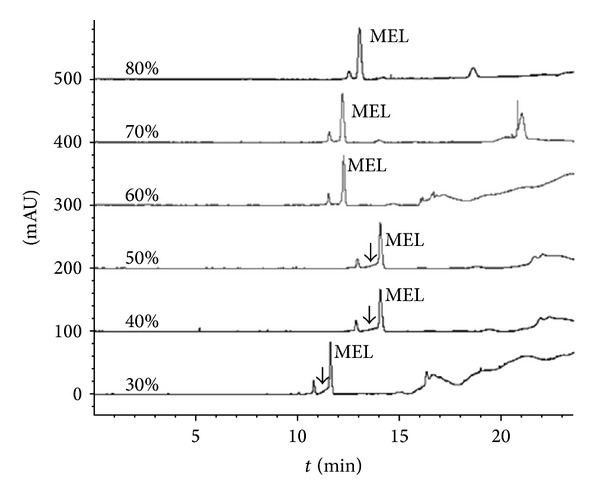
Figure 3.

Electropherograms of milk treated with different percentages of acetonitrile. Condition: samples were treated with different percentages of acetonitrile (v/v) and were injected hydrodynamically at 50 mBar for 50 s. All samples contain 10 mmol/L NaCl and 8 mmol/L pH 2.8 phosphate solution and 3 μmol/L MEL.
