Figure 4.

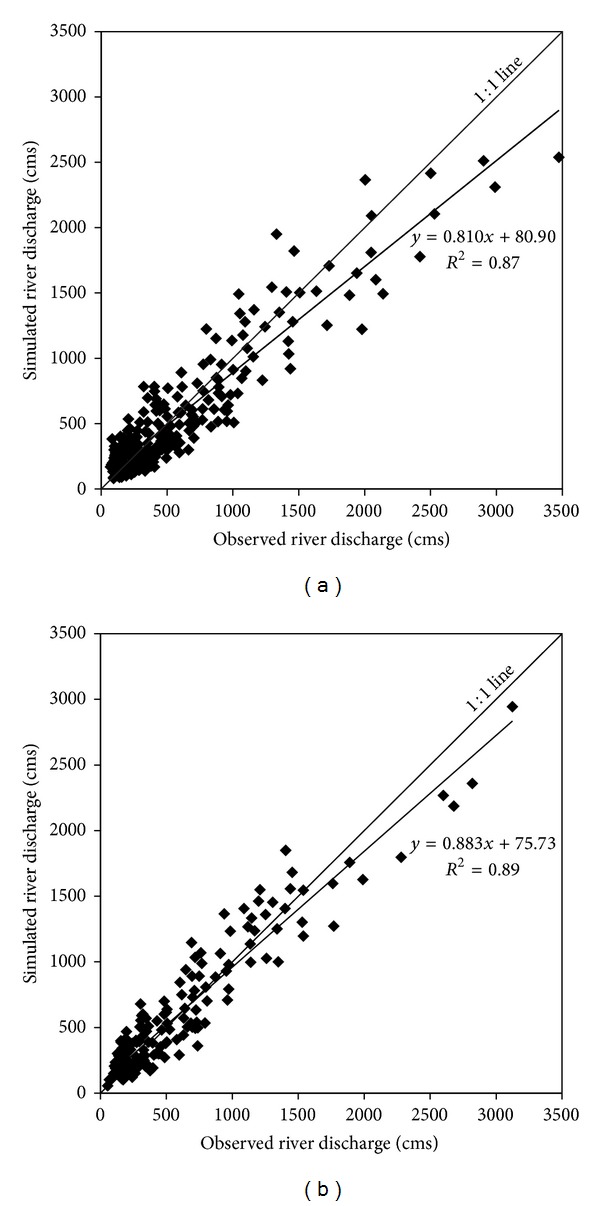
Regression plots of simulated versus observed discharge relative to 1 : 1 line for (a) 25-year calibration period (1971–1995) and (b) 15-year validation period (1996–2010).

Regression plots of simulated versus observed discharge relative to 1 : 1 line for (a) 25-year calibration period (1971–1995) and (b) 15-year validation period (1996–2010).