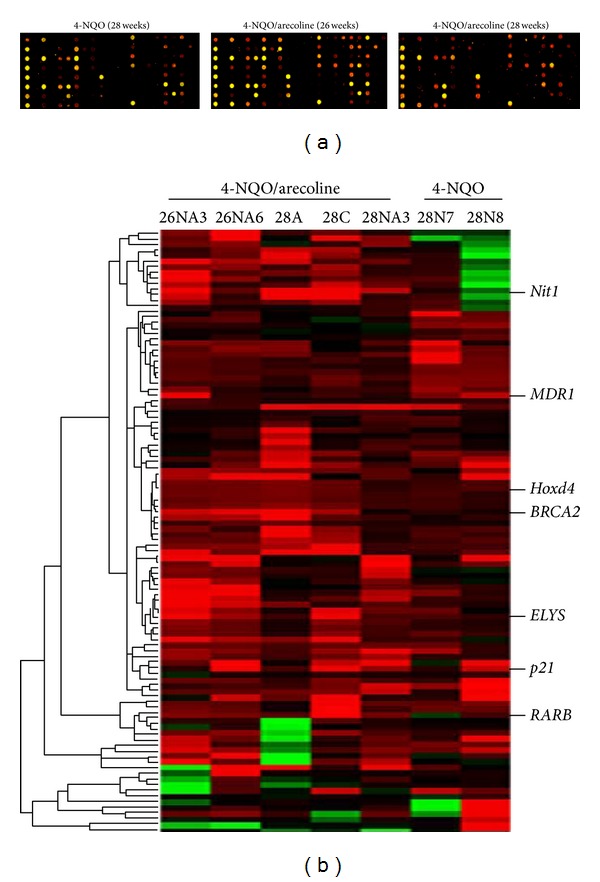
Figure 2.

Presenting of MCGI microarray hybridization results and hierarchical clustering of methylation data of OSCC model mice. (a) MCGI microarray hybridization panel contained 4,608 duplicated CpG island tags. The expanded hybridization views showed the usefulness of the MCGI microarrays cohybridized with fluorescently labeled T (tumor part) and NT (nontumor part) with N at 28 weeks and NA at 26 and 28 weeks. Spots hybridized predominantly with tumor amplicon but not with normal amplicon would appear red and are indicative of hypermethylated CpG island loci present in the tumor genome. (b) Hierarchical clustering of N (4-NQO) and NA (4-NQO/arecoline) samples. At the top lists the 5 NA and 2 N studied. The row corresponds to each of 109 CpG island loci selected for methylation analysis. CpG islands (the normalized Cy5 : Cy3 ratios are ≧2) are those with hypermethylation in tumor DNA. The selected hypermethylated candidates were showed on the right sides. They are described in greater detail in Table 2.
