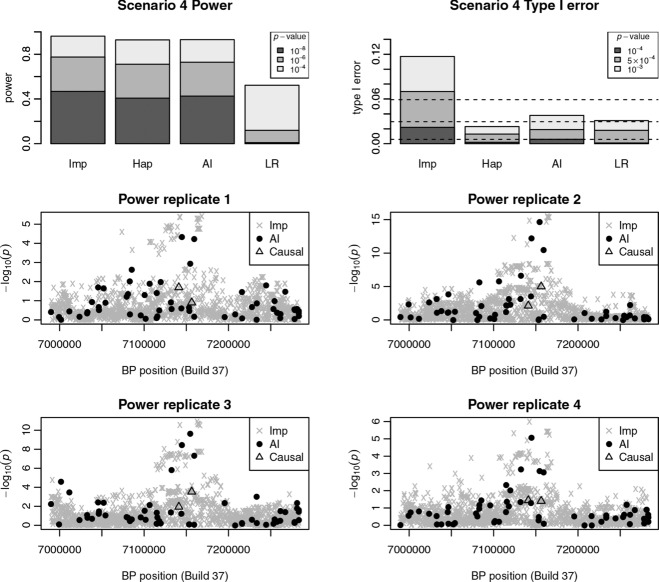
Figure 3.
Results from Scenario 4 (haplotype effects). The top plots shows bar plots of the calculated powers (for P-values 10−8, 10−6, and 10−4) and type I errors (for P-values 10−4,  , and 10−3) for imputation (Imp), haplotype analysis (Hap), single-SNP logistic regression (LR), and the AI test. The bottom plots show examples of results from four separate power replicates. Gray crosses show the results obtained from imputation, black dots show the results obtained from AI, and triangles show the imputation results obtained at the two causal SNPs. The default window size of 10 SNPs was used in the AI test.

