
Figure 6.
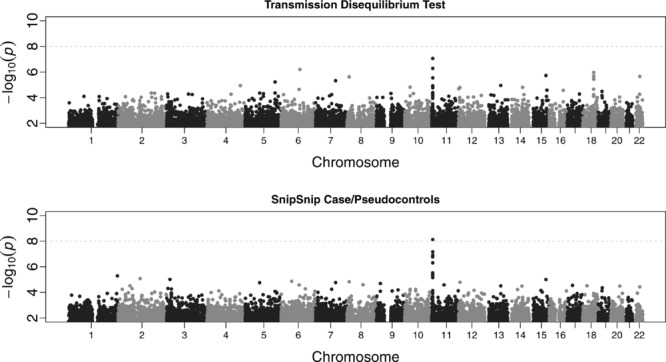
Manhattan plots of each chromosome for the case-parent trio severe malaria dataset from The Gambia. The top plot shows P-values using the transmission disequilibrium test as implemented in PLINK. The lower plot shows AI test P-values. The black and gray points highlight different chromosomes.