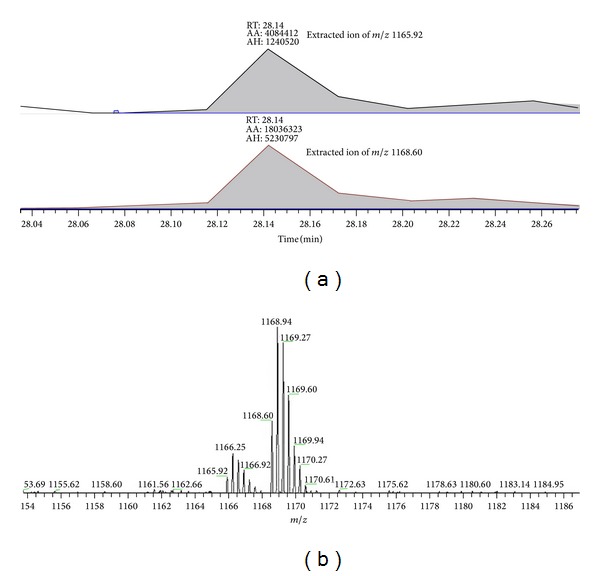
Figure 4.

(a) Extracted ions of m/z 1165.92 (H-labeled) and m/z 1165.92 (D-labeled) showing signals of peak area (AA) and peak height (AH). (b) MS spectrum of GVDNTFADELVELSTALEHQEYITFLEDLK which are labeled formaldehyde-H2 and formaldehyde-D2. These two labeled peptides are shown in a coeluted isotopic pattern.
