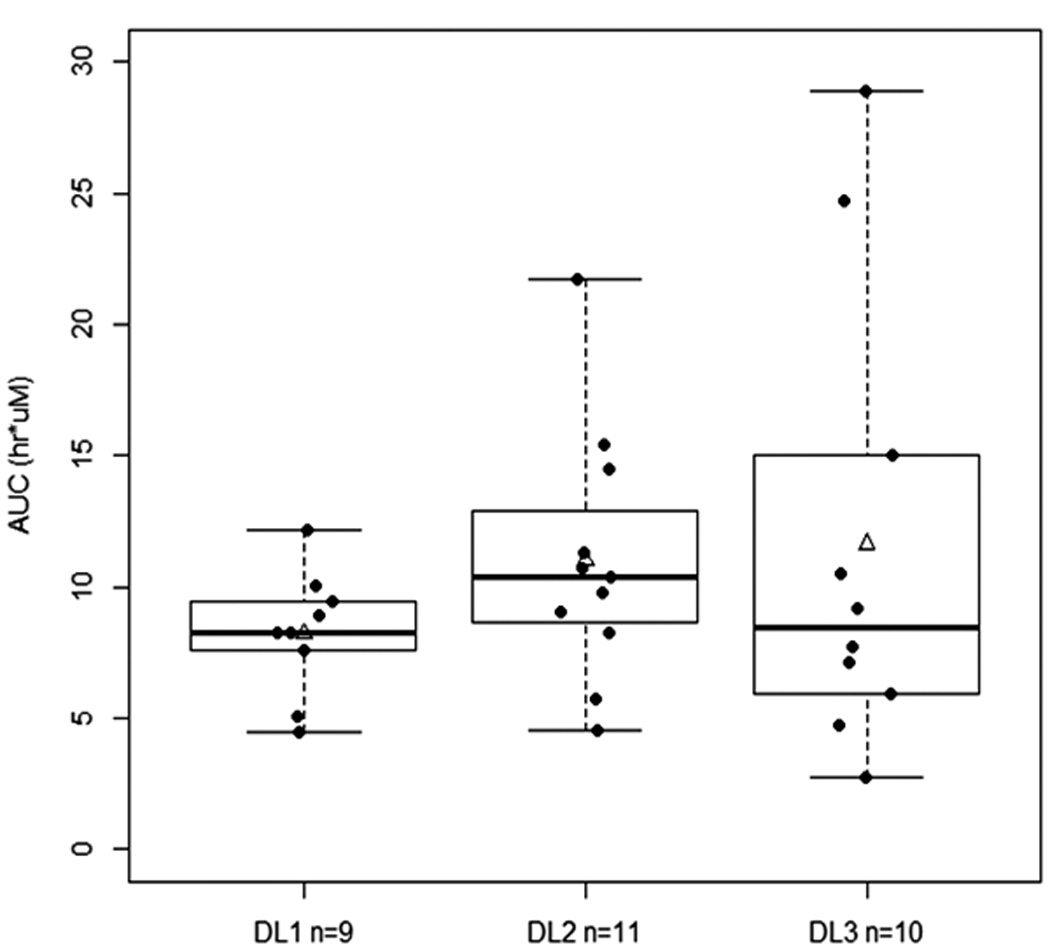
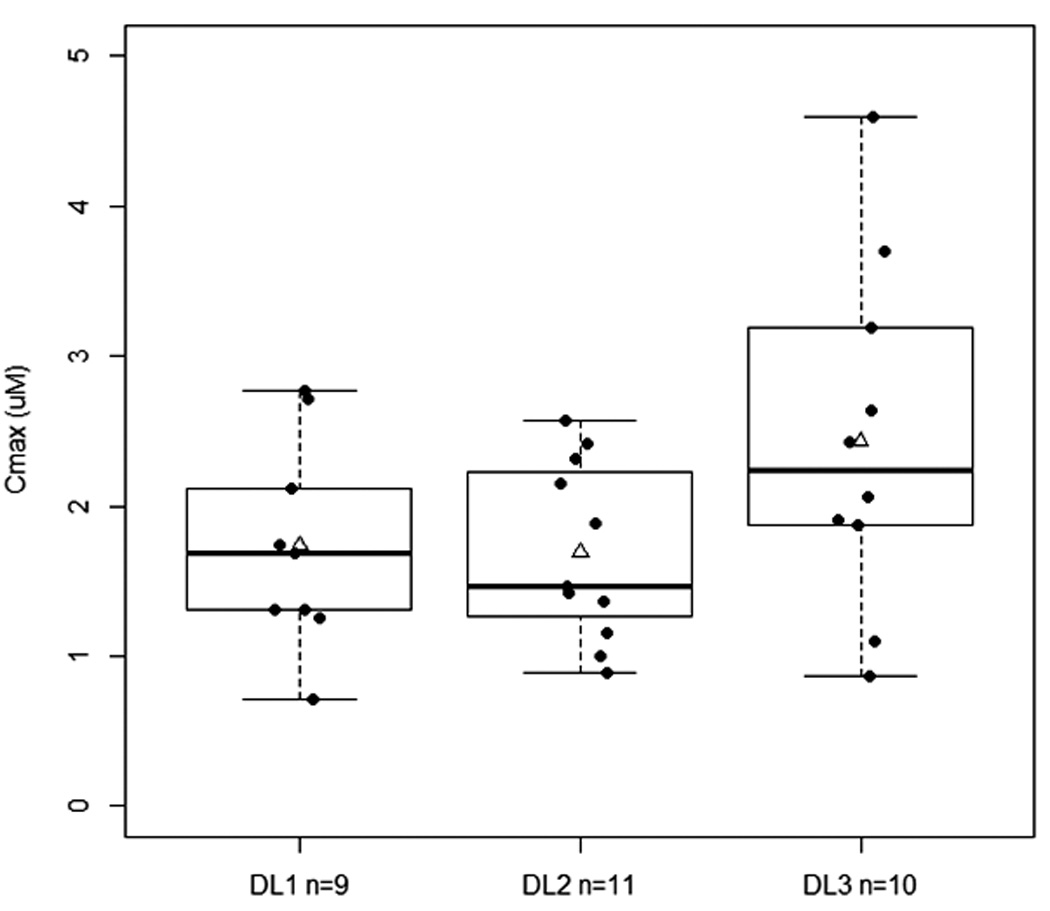
Figure 1.


A. Relationship between C1D1 AUC0-∞ and dose levels (P=0.36, Kruskal-Wallis test). B. Relationship between C1D1 Cmax and dose levels (P=0.11, ANOVA). DL1, Dose level 1= 30/30 mg; DL2, dose level 2=30/50 mg; and DL3, dose level 3=50/50 mg. Solid line within the box represents the median, the lower and upper box borders represent the first and third quartiles, and the whiskers extend to the minimum and maximum values. The mean is marked with a triangle.
