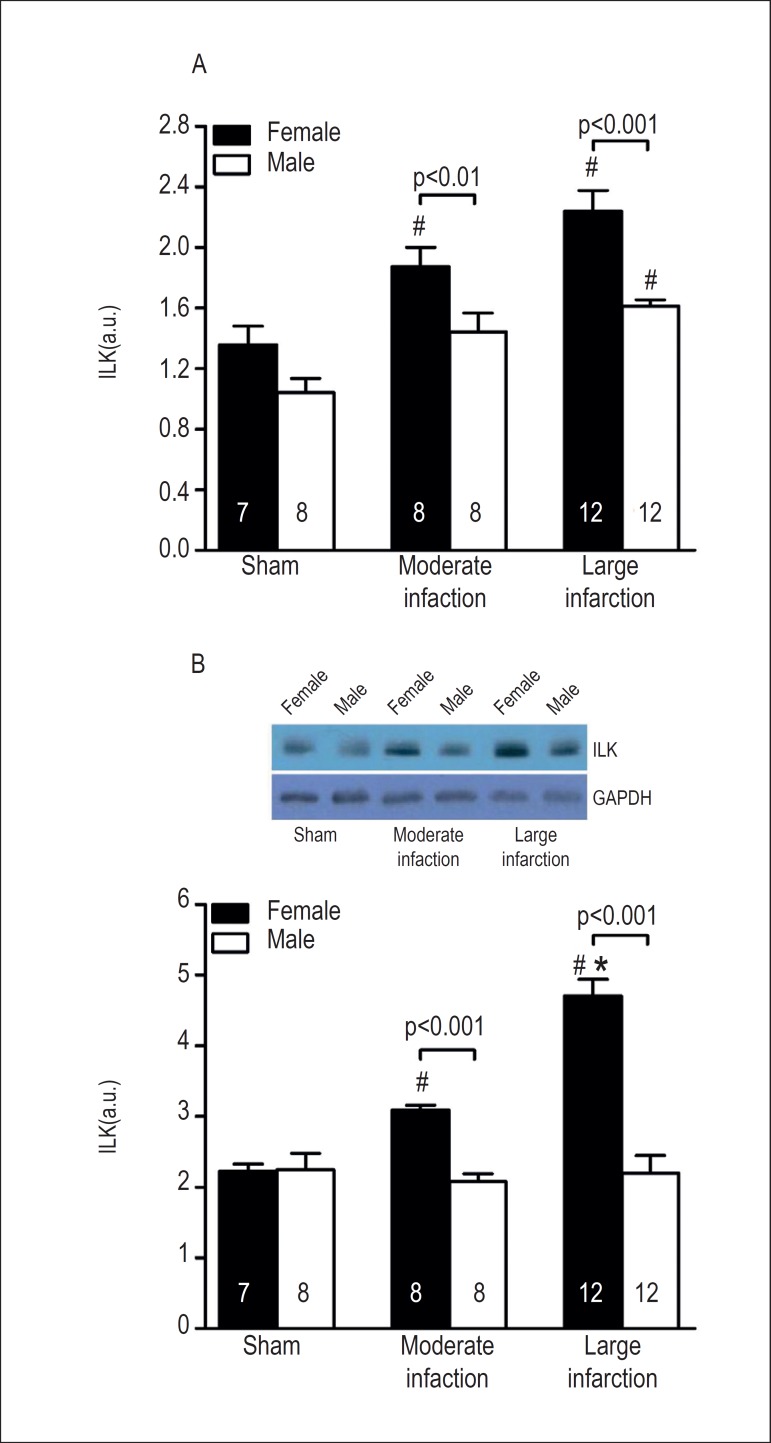
Figure 1.
Quantification of (A) ILK mRNA and (B) ILK protein expression in the myocardium of sham-operated and infarct-operated female and male rats, respectively. ILK levels are plotted as a function of MI size. The sample size is shown into the bars. #p < 0.001 vs. respective sham; *p < 0.001 vs. respective moderate infarction.

