
Figure 7.
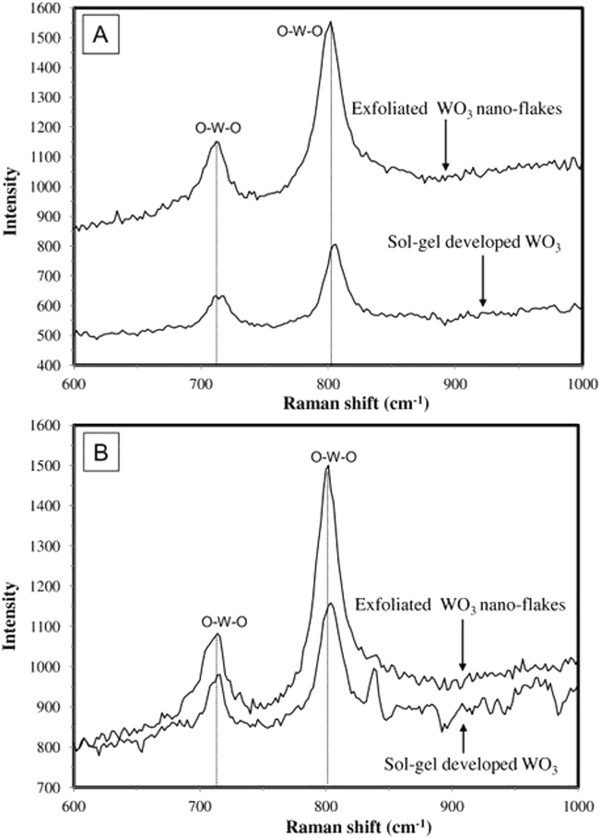
Raman spectra (perturbation region within 600 to 1,000 cm-1) for sol-gel-developed WO3 and exfoliated Q2D WO3 nanoflakes. Sintered at 550°C (A) and 650°C (B), respectively.
Official websites use .gov
A
.gov website belongs to an official
government organization in the United States.
Secure .gov websites use HTTPS
A lock (
) or https:// means you've safely
connected to the .gov website. Share sensitive
information only on official, secure websites.
Raman spectra (perturbation region within 600 to 1,000 cm-1) for sol-gel-developed WO3 and exfoliated Q2D WO3 nanoflakes. Sintered at 550°C (A) and 650°C (B), respectively.