Figure 8.

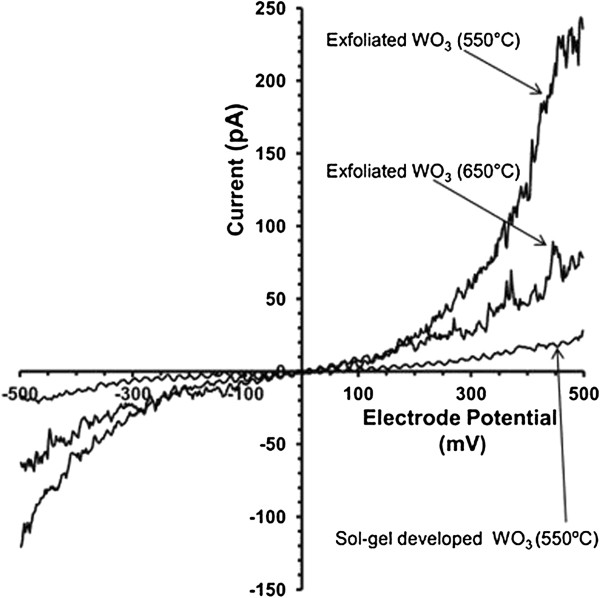
I-V curves derived from CSFS-AFM images for sol-gel-developed WO3 and exfoliated Q2D WO3 nanoflakes. These I-V curves have been obtained by averaging the current values recorded independently for different DC sample bias.

I-V curves derived from CSFS-AFM images for sol-gel-developed WO3 and exfoliated Q2D WO3 nanoflakes. These I-V curves have been obtained by averaging the current values recorded independently for different DC sample bias.