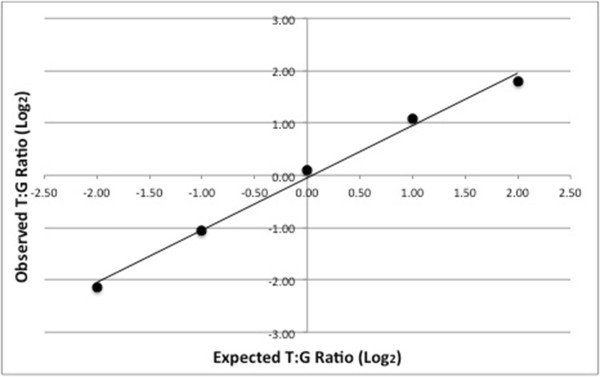
Figure 2.

Linearity of allelic expression assay. Different proportions of rs76719109 T and G homozygous cDNA were mixed to test the linearity of the AEI assay. The T:G ratios were 1:4, 1:2, 1:1, 2:1, and 4:1. An overall linear relationship was found (r2 = 0.99). The slope was 0.999, i.e., the assay detected the T and G alleles with equal efficiency. The graphs are plotted log2 to avoid compression at the lower ratios and thereby better visualize the data [22].
