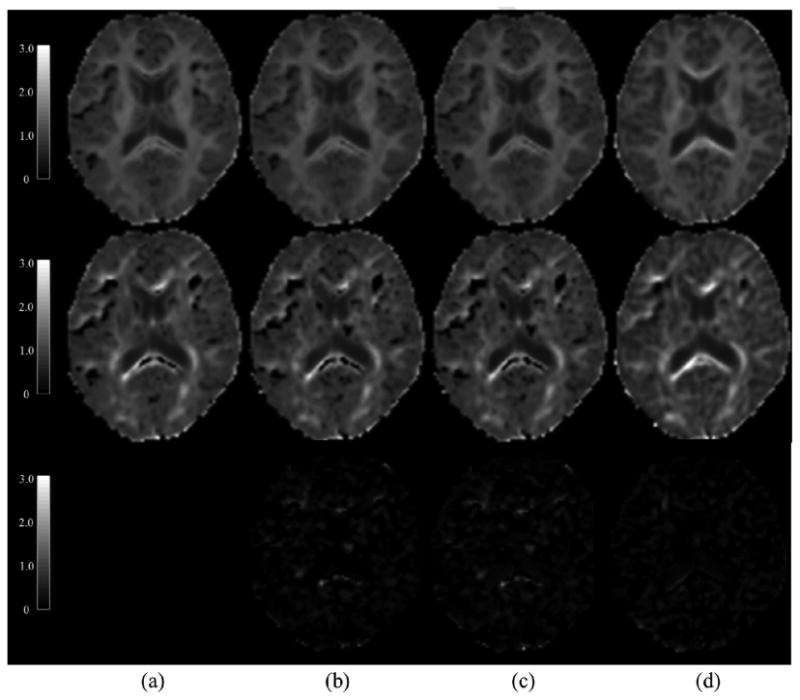
Figure 10.

A typical example of the MK and AKC maps generated by our AIS methods. The MK map (first row) and the AKC map (second row) from one typical gradient direction were estimated from a DKI sub-dataset of 4 b-values, the difference maps of AKC (third row ) were also calculated between the reference map and the map of each individual AIS method. (a) the reference maps of MK and AKC; (b) maps calculated by UAIS method; (c) maps by CAIS; (d) maps by SCAIS. The result showed that AKC and MK maps of SCAIS had no dark band effect, and meanwhile SCAIS enhanced tissue visibility of the structural details in the AKC and MK maps. Moreover, the difference maps showed that AKC map from SCAIS was most similar to the reference maps than other two methods. Please note that the difference contains also voxels where SCAIS had more accurate estimation whereas the UNLS method generated black band.
