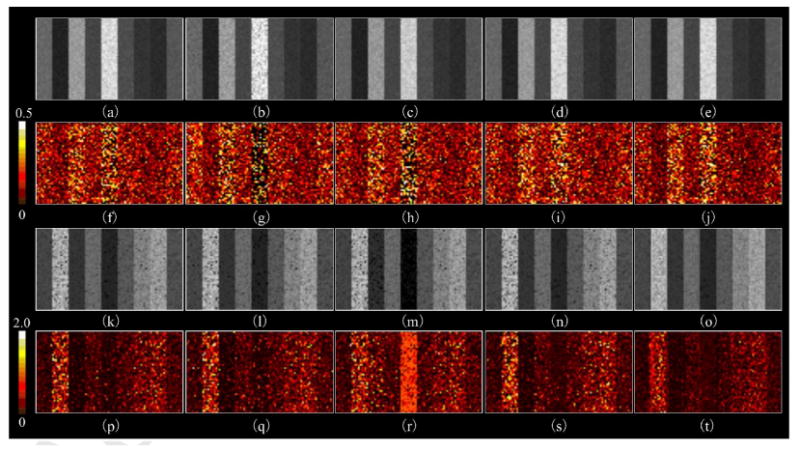
Figure 4.

A visual presentation of the estimated ADC and AKC maps using noised synthetic DWI data (SNR = 30). (a ∼ e) are the ADC maps calculated by UNLS, CLLS, CML, CAIS, and SCAIS, and, (f ∼ j) are their corresponding residual maps (absoluate difference between the resulting maps and their reference maps); (k ∼ o) are the AKC maps by UNLS, CLLS, CML, CAIS, and SCAIS, and (p ∼ t) their residual maps. The results (particularly the residual maps) showed that our SCAIS method (last column) performed more robustly to noise than other methods, and estimation error of CLLS raised significantly at regions of high ADC values (left side portion of (g)).
